Section off


bkuchhal
Sat, 04/13/2024 - 10:18 am
Hello,
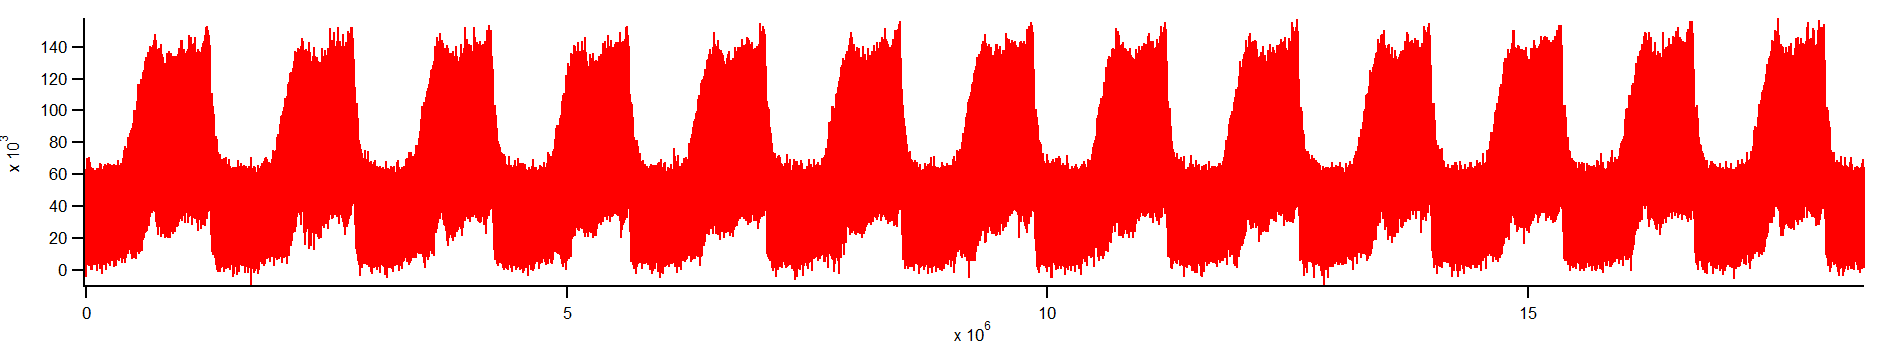
I have a large amount of noisy data. As you can see in the figure, there is a repetitive pattern of noisy data. I would like to slice up this to get all the patterns and average over them. But the data has 18.5M points. And I need to figure out what is the repetition rate. I have tried auto-correlating the data to figure out the repetition. But it didn't help much. Any suggestions?
Getting the 'frequency' of repetition is exactly what a Fourier transformation is for, so you can try this on your data. I just tested this with a simple sine function and it worked quite well. I don't know how the noise in your data is affecting your result, but you should look for the lowest-frequency spike in the Fourier-transformed output. Maybe you start with something like this:
FFT/OUT=3/DEST=mydata_FFT mydata(Note that this only works on an even number of points, but you can select a sub-range if your input is uneven)
April 14, 2024 at 07:40 am - Permalink
Before using the FFT, remove the constant offset by subtracting out the mean. This will improve the accuracy of the lower frequency results of the FFT.
April 14, 2024 at 12:46 pm - Permalink
Thank you for your answers! Turned out that autocorrelation gave me the same answer. But yes, the problem is still not entirely resolved as the periodicity is ~1.4M points out of a total of 18.5M points. Even though the number makes sense, not every section is identical. For example, I put the first and last section on top of each other and they were quite far apart to do proper averaging.
April 17, 2024 at 05:05 pm - Permalink
Hi,
One thing to add as an aside, I would recommend that you use dots instead of lines between points, the default. Sometimes the drawing of the lines can mask some structure in the data such as an oscillation that could be adding complexity to the analysis.
Andy
April 17, 2024 at 05:32 pm - Permalink
If the first and last sections are off, doesn't this mean that your periodicity is slightly off, which propagates as error through ~13 repetitions? Or is this due to jitter?
April 17, 2024 at 07:39 pm - Permalink
I'd first try the DSPPeriodogram operation. You can use the /NODC=1 flag and /SEGN={ptsPerSegment , 0 } to make sure that you get some statistical averaging over fluctuations in the spectra.
AG
April 18, 2024 at 06:23 am - Permalink
In reply to If the first and last… by chozo
@chozo: Well, there's a drift in the signal. The long trace I showed earlier is a scope trace. So the 1st point in the long trace is around 2-3ms. And the last point is at 10ms. Between 0-3ms, there is a large amount of smearing due to the drift, so I had to delete that portion of the data.
@Igor: In the /SEG flag, how do I figure out the number of segments? And how does this help with averaging?
April 18, 2024 at 08:50 am - Permalink