Demo Carnot Cycle

jjweimer
Mon, 03/01/2010 - 05:03 pm
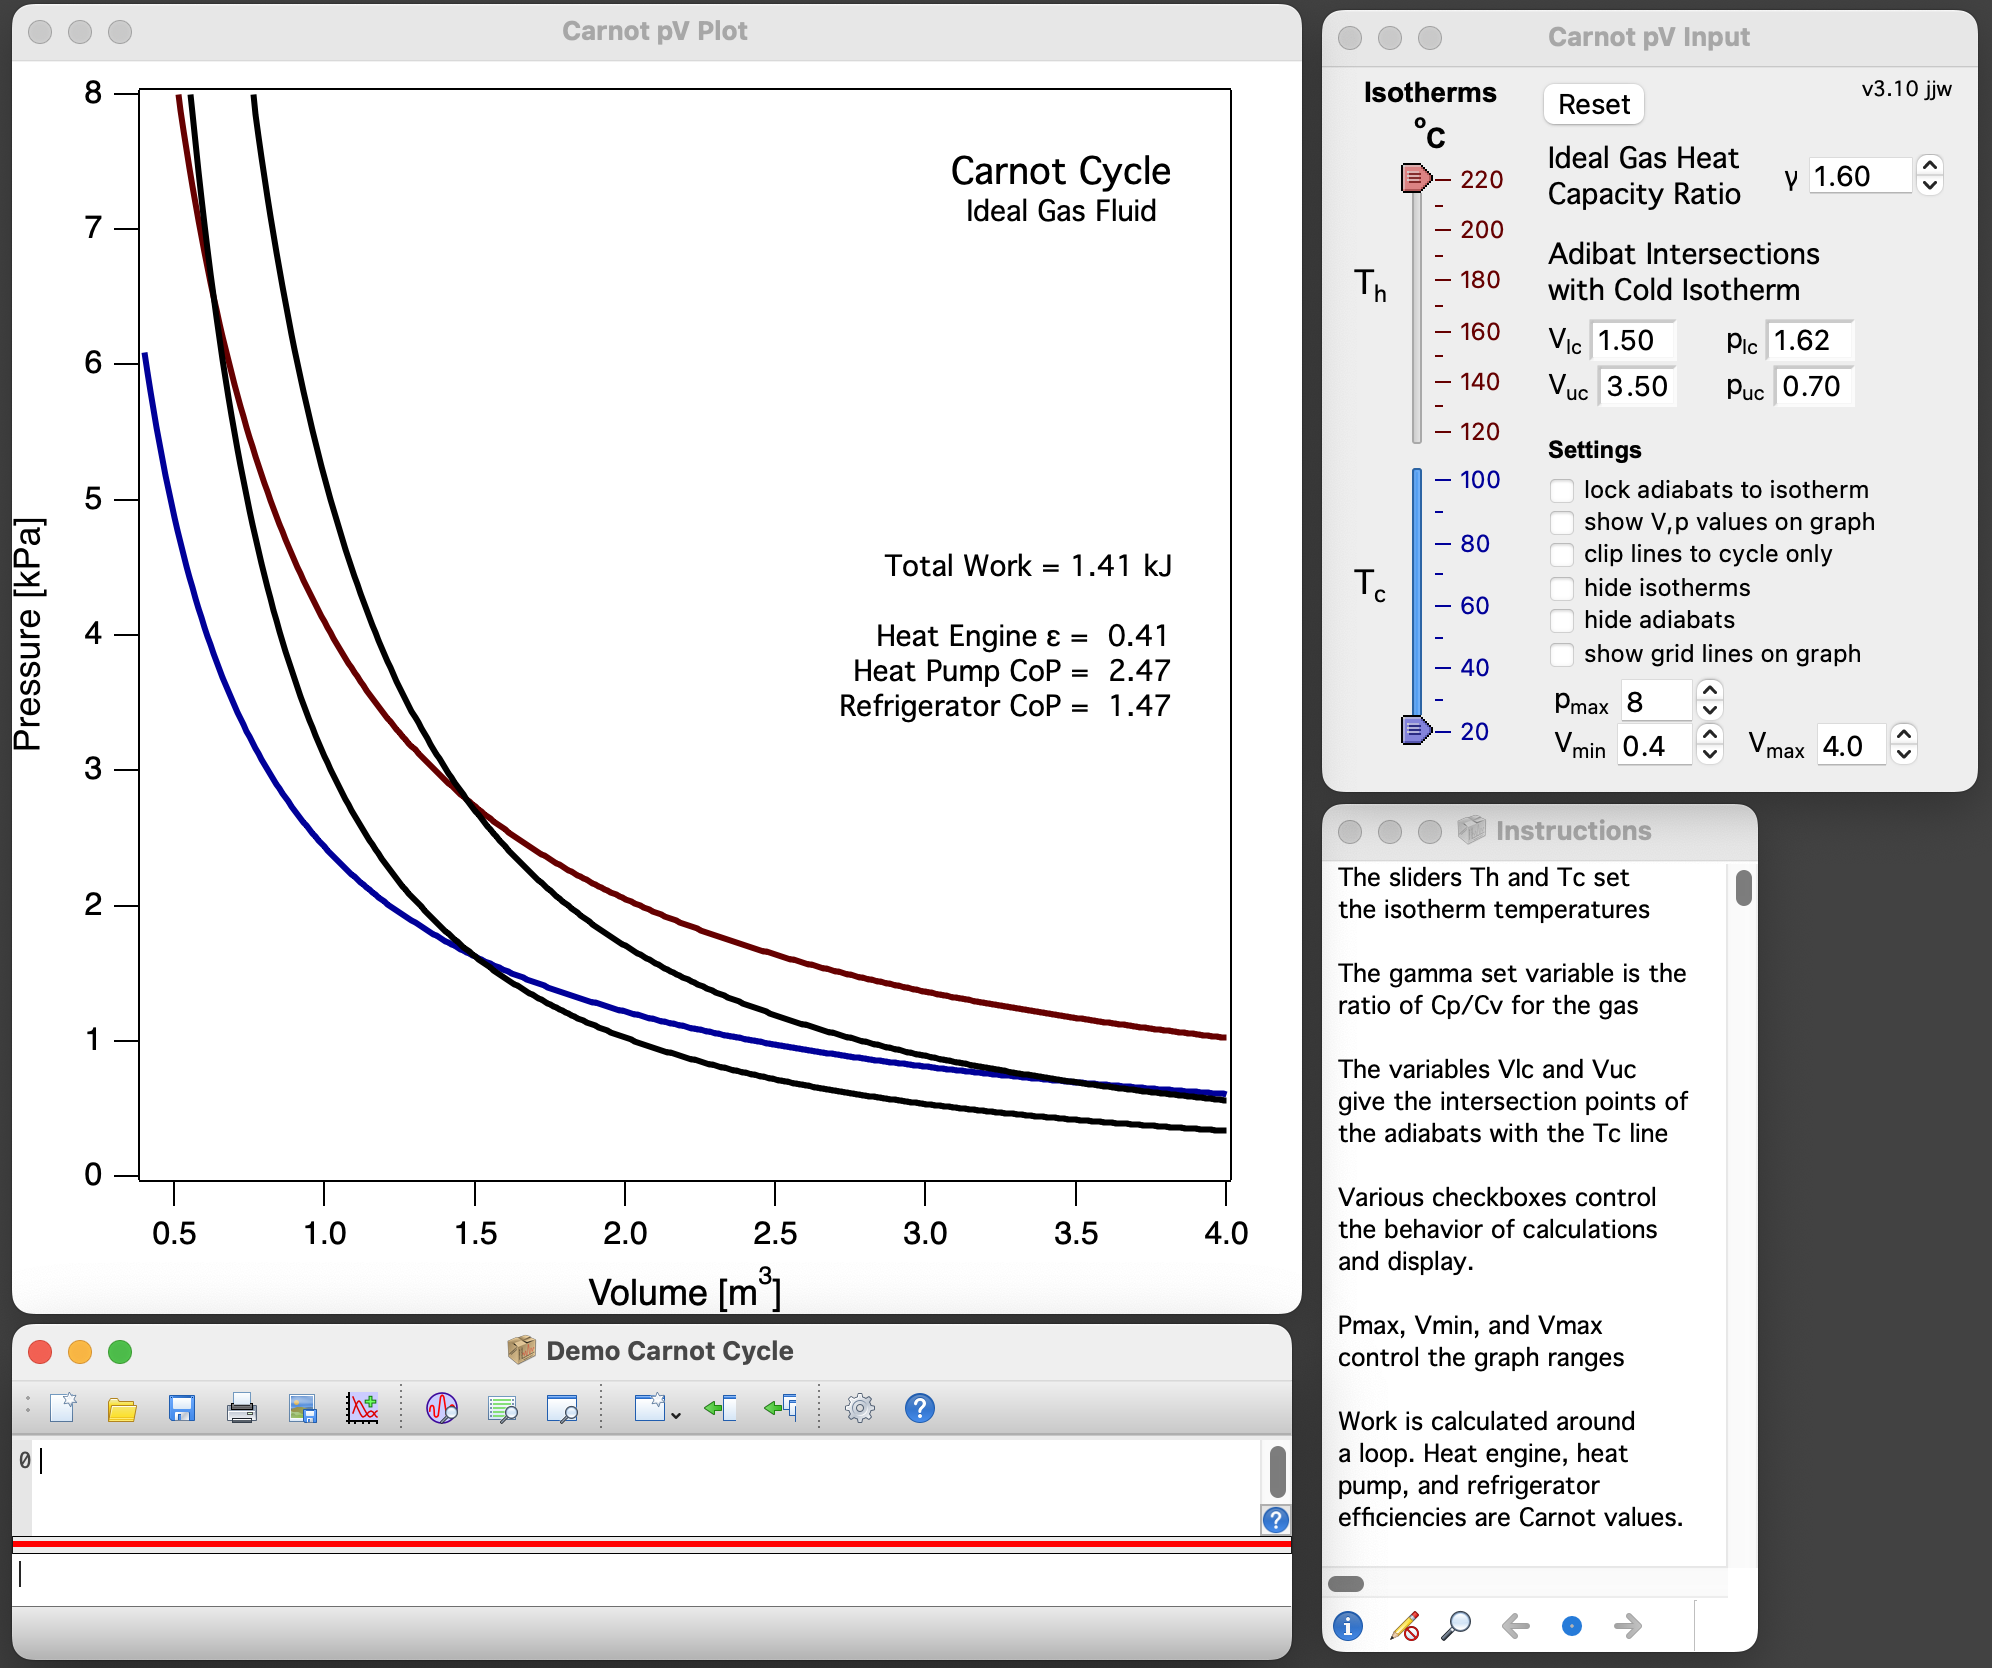
Overview
This stand-alone demonstration shows the behavior of a Carnot cycle.
Distribution Details
- Experiments: Demo Carnot Cycle
- Procedure Files: self-contained (adopted)
- XOPS: none
- Requires Packages: NONE
- Help Files: a notebook outlines the operation in the demo
- Documentation: the Web pages for this project
Installation
The demonstration is self-contained.
Images:
Project Details
Current Project Release
| Release File: | Demo Carnot Cycle v3.10.zip |
| Version: | 3.10 |
| Version Date: | Mon, 03/27/2023 - 12:45 pm |
| Version Major: | 3 |
| Version Patch Level: | 10 |
| OS Compatibility: | Windows Mac-Intel |
| Release Notes: |
Bug Fixes
Improvements
|

Forum

Support

Gallery
Igor Pro 9
Learn More
Igor XOP Toolkit
Learn More
Igor NIDAQ Tools MX
Learn More
I think the CarnotpVCalculator ipf was not adopted in the pxp released as version 3.00?
'Adibate intersections' looks like a typo, and adiabates should be adiabats
I'm looking forward to trying out a fixed version!
March 27, 2023 at 03:36 am - Permalink
Thanks Tony! I think I got it right with this new posting.
March 27, 2023 at 12:51 pm - Permalink