Angle-averaged Intensity vs Radius Profile from Intensity Image
shifuxian
Mon, 10/16/2017 - 10:03 pm
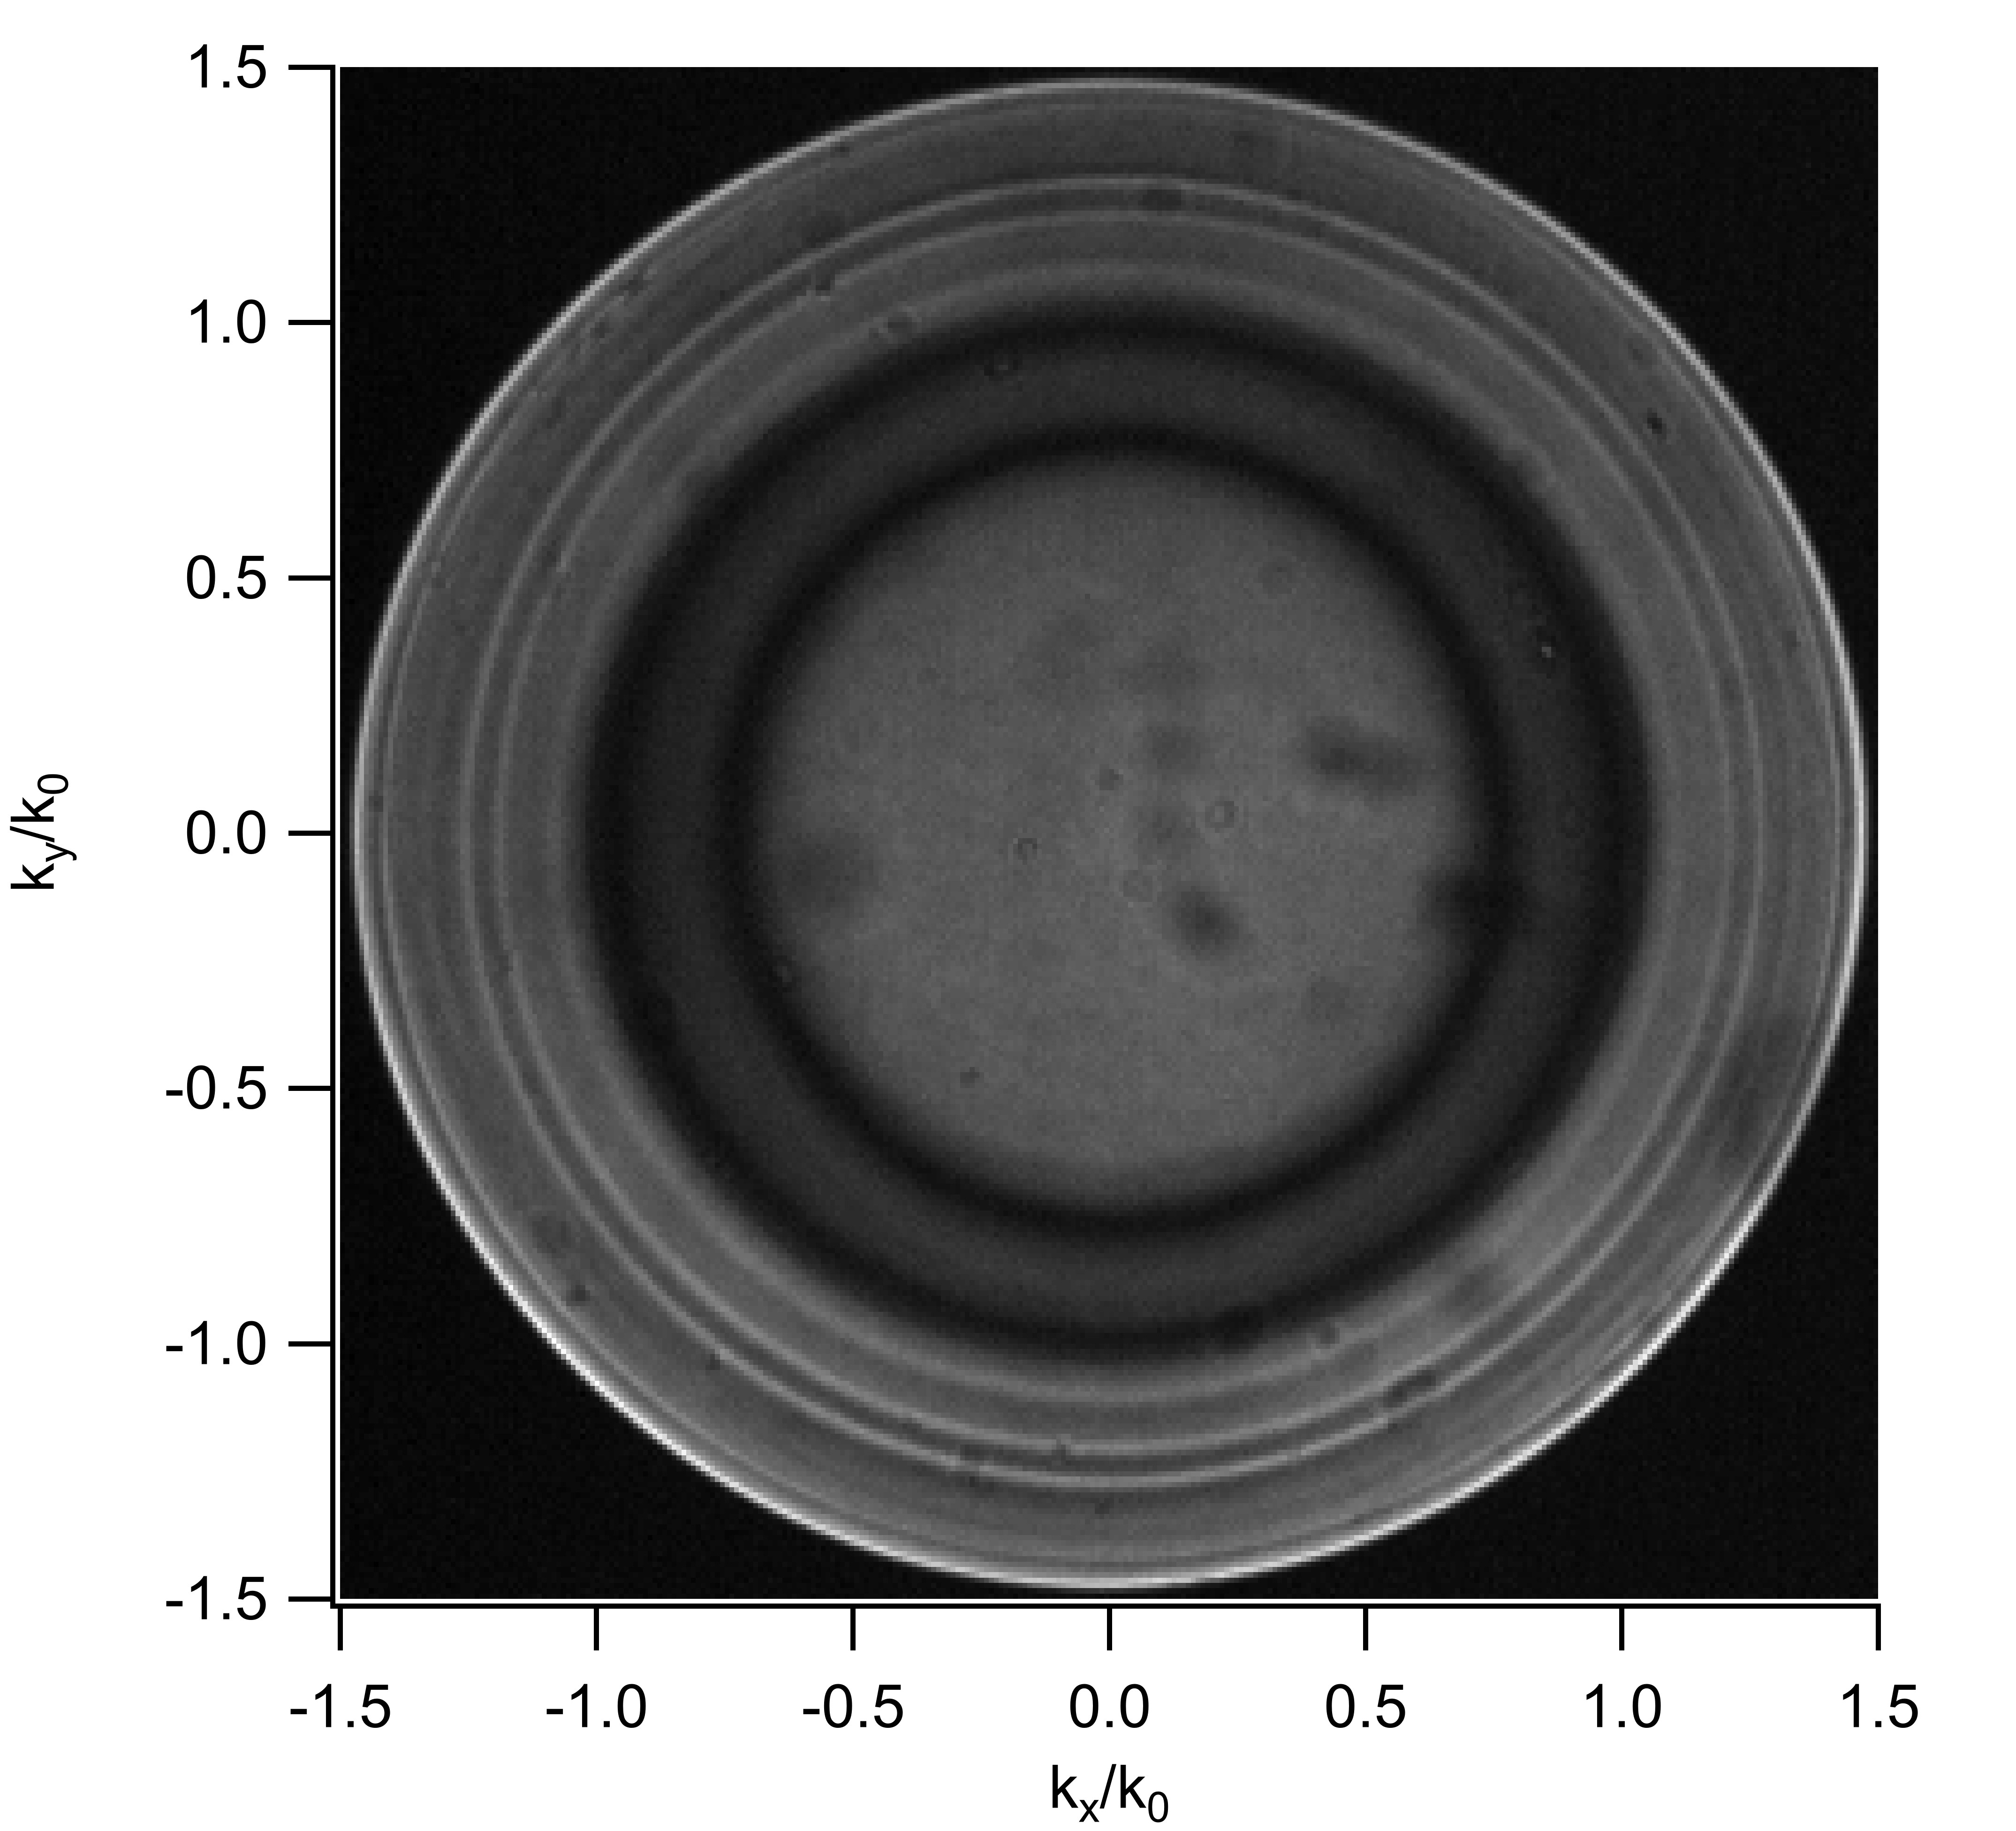
Hello, any inputs will be highly appreciated! I am working on a 2D wave corresponding to an intensity profile image. What I want to do is average the intensity for all angles for different radii so that I can have an angle-averaged intensity vs radius profile. First I went on to performing interpolation on the 2D wave to get an f(r,theta). I have tried some procedure to solve for the angle-averaged intensity for a given radius but I don't know how to do it for all radius so I can have a full intensity vs. radius plot. Also, since the ring-like structures of interest to me are not strictly circular (although they should be theoretically), my limits of integration for r should be functions but I don't know how to determine such function. Has anyone done such an analysis before? Thanks!
I'm attaching a sample of the image.
Graph4_0.jpg


wave wIn, wOut
variable px, py, ox, oy, mx,my
mx=dimsize(win,0)
my=dimsize(win,1)
ox=ceil(mx/2)
oy=ceil(my/2)
redimension /N=(ceil(sqrt((ox^2+oy^2)))) wOut
wOut=0
for (py=0;py<my;py+=1)
for (px=0;px<mx;px+=1)
wout[sqrt((px-ox)^2+(py-oy)^2)]+=wIn[px][py]
endfor
endfor
end
The output wave needs to exist (any size) before the function can be called.
Notes:
* This is not normalized!
* It contains artifacts for large radii (corners in the image).
* X, Y, R units are pixels
HJ
October 17, 2017 at 12:22 am - Permalink
Better yet, could you attach a sample wave?
best,
_sk
October 17, 2017 at 12:24 am - Permalink
October 17, 2017 at 12:55 am - Permalink
Here's a sample 2D wave that I'm working on. Thanks!
October 17, 2017 at 03:34 am - Permalink
This is a very interesting approach! How do I define a "center" of my matrix code-wise? Also, maybe I can use bins to collect values falling inside a radius value or range? Thanks a lot for the input.
October 17, 2017 at 03:41 am - Permalink
I'm afraid it's an intensity vs. radius profile that I need. I'm doing spectroscopy measurements, not scattering.
October 17, 2017 at 03:42 am - Permalink
One idea to find the center and this depends on the consistency of your images, is to use particle analysis to find the particle defined by the bright edge.
Use the M_rawmoments wave to calculate the center.
M_rawMoments Five column wave. The first column is the raw sum of the x values for each particle, and the second column contains the sum of the y values. To obtain the average or "center" of a particle divide these values by the corresponding area. The third column contains the sum of x^2, the fourth column the sum of y^2 and the fifth column the sum of x*y. The entries of this wave are used in calculating a fit to an ellipse (using the /E flag).
Andy
October 17, 2017 at 08:47 am - Permalink
October 17, 2017 at 12:44 pm - Permalink
1. Use ImageThreshold to delineate any ring of interest. It is OK if you get more than one ring for the same threshold range because different rings do not intersect.
2. Pass the thresholded image to ImageAnalyzeParticles. Make sure to pass the original data wave in the /D flag.
3. Your averaged intensity for each ring is in W_IntAvg.
I hope this helps,
A.G.
WaveMetrics, Inc.
October 17, 2017 at 12:55 pm - Permalink
I should add: Caution with non square images! The code assumes circles -- not ellipses...
HJ
October 17, 2017 at 01:51 pm - Permalink
Hello A.G.,
I have tried this procedure but this only gives me the average intensity for the 'dominant' rings (according to the result of ImageThreshold, there are 12) but I want to get a full intensity vs radius profile so this may not be enough. However, I am now following your suggestion to use the ImageLineProfile command in this blogspot: https://www.igorpro.net/blog/2017/4/4/how-to-average-data-over-an-annul…. I am using a family of ellipses as paths. It seems to work up until the generation of the paths and the getting of the average. Here's my function for the paths:
Function makePath(a,b)
Variable a,b
Make/O/N=(361) xTrace,yTrace
Variable i,alpha,da
alpha=-90
for(i=0;i<=360;i+=1)
xTrace[i]=a*cos(alpha*pi/180)+159.5
yTrace[i]=b*sin(alpha*pi/180)+143.5
alpha+=1
endfor
End
Now I want to write a main function to sweep all paths as a varies, since b can be related to a through the eccentricity, while at the same time encoding the averages to a new wave. How should I proceed? Thank you!
October 18, 2017 at 12:09 am - Permalink
wavetransform/o zapnans $s_wave(graph1_intensity). Then do the autocorrelation (w_corr) of the intensity matrix (w_img) (graph0_autocorr). Then find the center by fitting a 2d gaussian or getting the location of the maximum bywavestat(v_maxrowloc, v_maxcolloc).wavestats w_corr
Once in the center, define your equation for radius traverse, binning and averaging (traverse on an ellipse) with a threshold value for the intensity (i.e. reaching the outside bound of the intensity data). A heuristic data for this threshold based on your data can be something like:
670.best,
_sk
October 18, 2017 at 02:02 am - Permalink
for (j=0; j<Width; j+=1)
StretchRadius = sqrt((j-CenterX)^2+((i-CenterY)*YStretch)^2)
RadialIntensity[StretchRadius] = [...]
With the resulting profile and the three parameters I then create a synthetic image. The difference to the original image shows how much the model is still off. Using the standard deviation of the difference image as an input for Igors mighty Optimize allows to fine-tune the parameters.
The resulting difference image shows that the three parameter model is still somewhat off, but this method can easily be extended with additional parameters. May I ask how you created these images?
October 18, 2017 at 09:55 am - Permalink
I am wondering why isn't this intensity profile circular? Some non-flatness involved?
best,
_sk
October 19, 2017 at 12:42 am - Permalink
I'd be very careful mixing the two approaches. In order to use the method outlined in the blog post, you need to have a pair of waves that describes the path. To do that you need to analyze the image and possibly use some curve fitting to determine the path parameters. If you simply scan the threshold level you are letting particle analysis provide the equivalent of path waves so no fitting is involved and your measurement is direct. I do not understand which part of that approach failed for you.
Please be specific: which part does not work for you? The function as written requires that you know the parameters (as a function of r). Have you determined how to obtain a and b?
A.G.
WaveMetrics, Inc.
October 19, 2017 at 10:55 am - Permalink
Hello,
Yes I think it's because of some inhomogeneity in the sample surface levels. One of the layers deposited is thick (250 nm x 6 periods) and might have caused some distortion in the overall flatness.
October 21, 2017 at 01:08 am - Permalink
Hello,
These are back focal plane (BFP) images collected using a leakage radiation microscopy setup. Can you explain further how you came up with the synthetic image? Thank you!
October 21, 2017 at 01:10 am - Permalink
Hello A.G.,
It's now working! I used the a and b parameters of the most obvious ellipse I can find and the 'makepath' approach works well. I have another questions, however. I was trying to use the RESAMPLE command to make my data symmetric (square matrix) but for some reason it's only interpolating one side of the data so the actual image becomes distorted on that side. Is there a way to specify that I want to interpolate the entire data set? Thank you!
October 21, 2017 at 01:35 am - Permalink
It's really important to pay attention to the details of a question. "I was trying to use the RESAMPLE " does not even begin to suggest what you were doing. Please take the time to include full details to the point that anyone reading this can try your syntax and maybe find why you were not successful.
Regardless, I would be inclined to use ImageInterpolate instead of Resample.
A.G.
October 23, 2017 at 11:39 am - Permalink
I was working on the same 2D wave corresponding on the intensity profile. Since that wave is a 320 by 288 matrix, I was hoping to be able to reduce it to a square matrix, i.e. 288 by 288, by using RESAMPLE on the x-axis. So I use the Igor Pro menus: Analysis>Resample. In my matrix, x has 320 elements and y has 288 so I chose to resample rows with a resampling frequency of 0.905. As we can see in the menu, it's supposed to reduce our 320x288 matrix to 288x288. However, in the image plot of the resampled wave, I noticed two things: (1) the x-axis still says 320 even though the resampled matrix now only has x=288 and (2) the right edge of the image appears to be distorted. I am attaching the wave, images and menus below:
October 23, 2017 at 07:57 pm - Permalink
John Weeks
WaveMetrics, Inc.
support@wavemetrics.com
October 24, 2017 at 09:37 am - Permalink
make/O/N=(Width,Height) ModelImg
for (i=0; i<Height; i+=1)
for (j=0; j<Width; j+=1)
StretchRadius = sqrt((j-CenterX)^2+((i-CenterY)*YStretch)^2)
ModelImg[j][i]= RadialIntensity[StretchRadius]
endfor
endfor
I have attached my experiment, although it already became a bit cluttered. There is some supersampling and debug output going on which make the code harder to read, but it also helps in visualizing what is going on with the data.
Instead of just accumulating the pixel values in a 1D-wave I first rearrange them into a 2D-image to see which values are sorted into which bin. This image still shows a lot of waviness, even with optimized ellipse parameters. Averaging the columns of this image destroys a lot of local information which in turn can be seen as high frequency components in the difference image.
LR microscopy sounds like cool stuff. From what I learned about it yesterday the deformation of the circular pattern should contain some information about the shape of the SPP emitter. Maybe it would be a better idea to only integrate over several small angular ranges and use this data for further processing.
October 25, 2017 at 02:32 am - Permalink