Plotting Part of a wave in a particular way


Dolbash
Wed, 06/14/2017 - 07:48 am
function flipdat()
wave testwave1='wave1'
variable totpoints=numpnts(testwave1) //wave being inspected
make/o/n=(TOTPOINTS/2) testwave1a //make 2 waves, each half the points of the source wave
make/o/n=(TOTPOINTS/2) testwave1b
wave testwave1a
wave testwave1b
Duplicate/o/r=(0,(totpoints/2)-1)testwave1, testwave1a //from 0-1/2 of the full points, make a new wave
Duplicate/o/r=(totpoints/2,totpoints-1) testwave1, testwave1b //from 1/2- full points , make the second wave
reverse/p testwave1b // reverse the second wave so that the second half is upside down, like the first image
string graphname
prompt Graphname," what is the Unique name of the graph?"
doprompt "Naming your graph" Graphname //give the graph a unique name
Display/k=1/N=$graphname/W=(100,0,3000,1000) testwave1a //make a graph with the first wave
appendtograph/w=$graphname testwave1b // append to the first waves' graph the second one
end
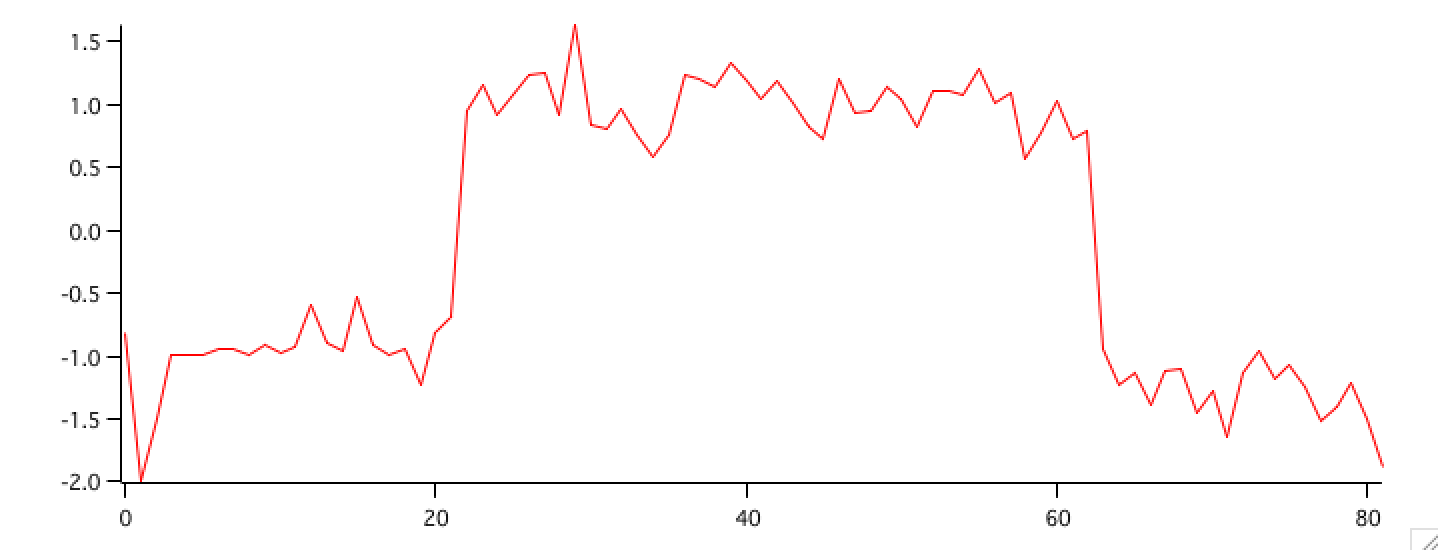
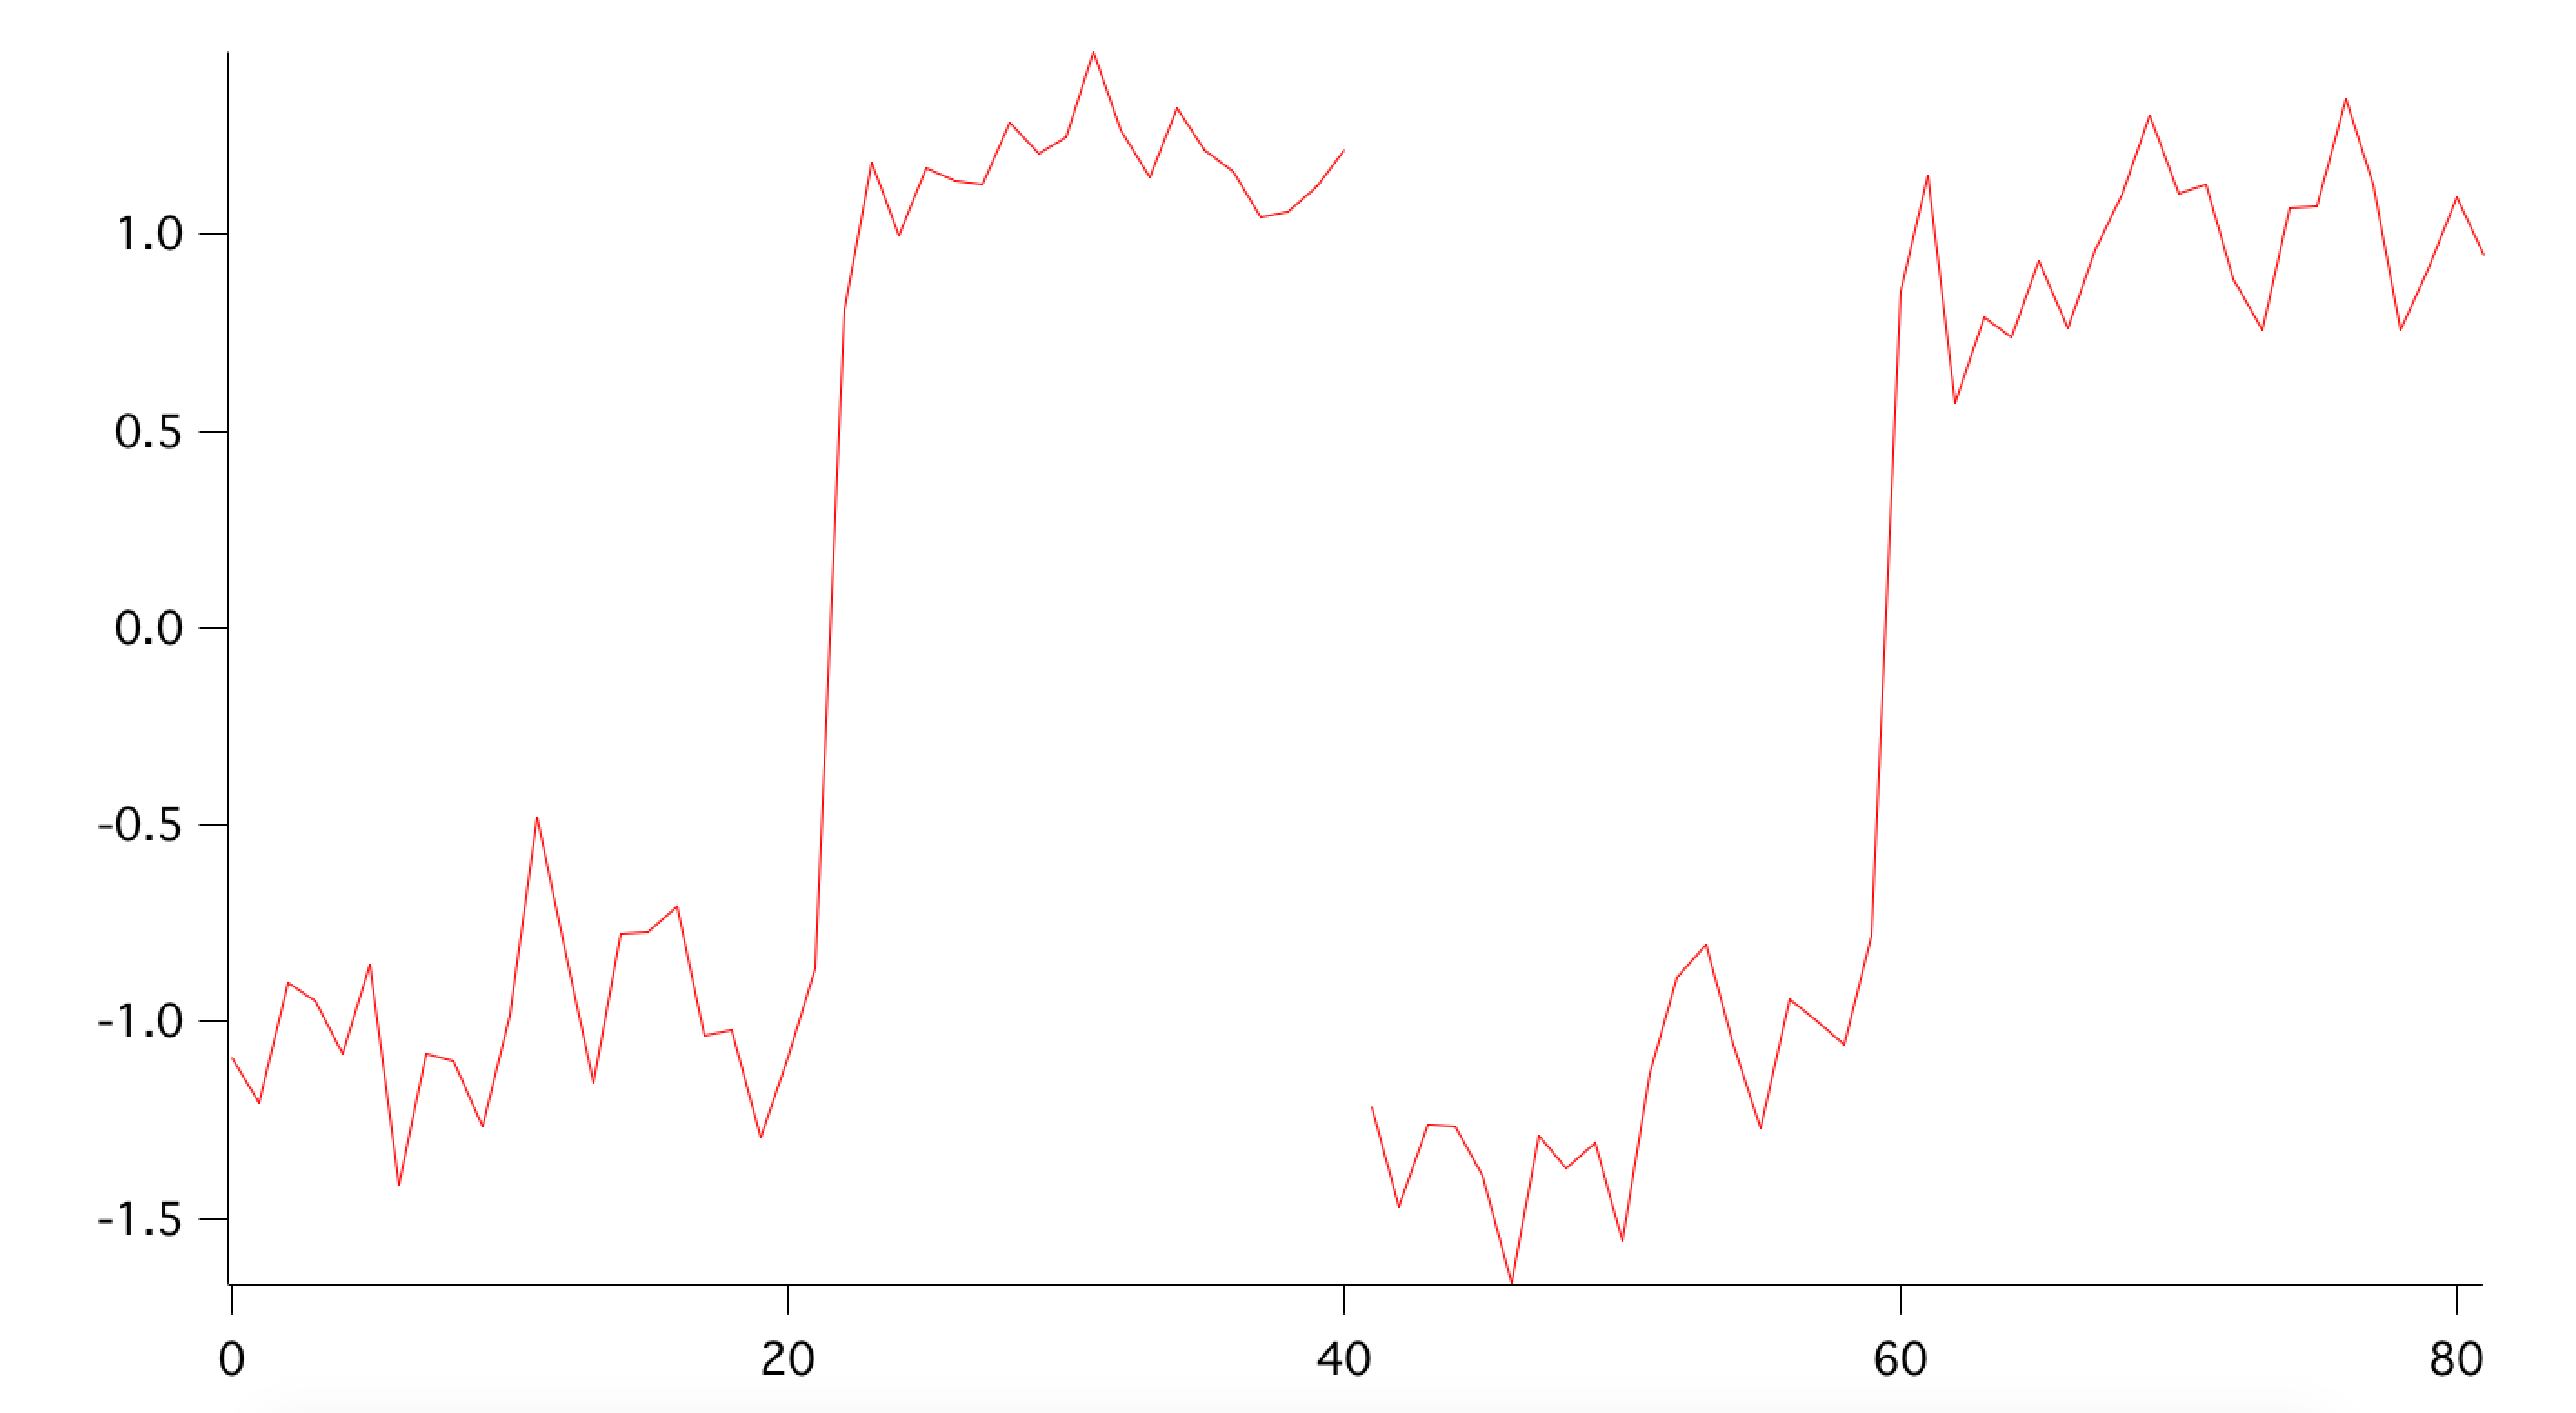
the propblem is that the graph ends up looking like my third picture. even though the data points for the duplicated "testwave1b" run from 0-40 on a table, they plot at 40-80 because that is what they were in the original wave. I think it has to do with some some dimensional stuff, since I ran into a similar problem with the reverse function, which was handily solved with the /p flag. I can see how it would be convenient to have a graph piece retain its absolute points in space in most cases, but in my case I need it to shift itself to start at 0, just like the other piece.
I'm sure there is something easy I'm msssing, but I hope ya'll can help, Thanks!

June 14, 2017 at 08:12 am - Permalink
--
J. J. Weimer
Chemistry / Chemical & Materials Engineering, UAH
June 14, 2017 at 08:26 am - Permalink
June 14, 2017 at 10:13 am - Permalink