Goodness of fitting


Konstantinos Chatzipanagis
Mon, 05/15/2017 - 03:59 am
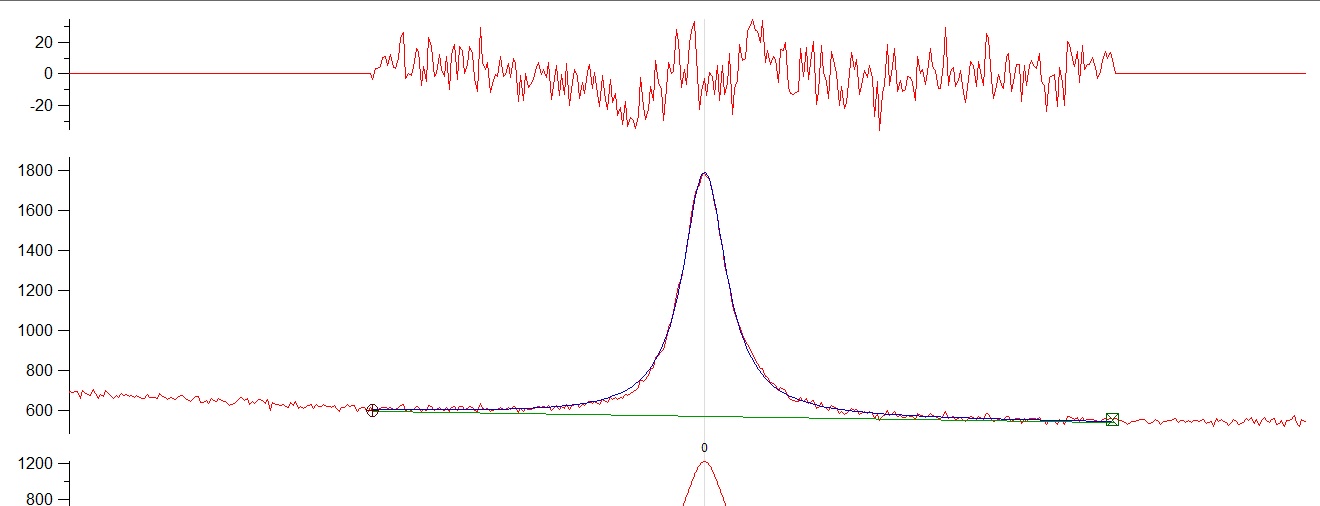
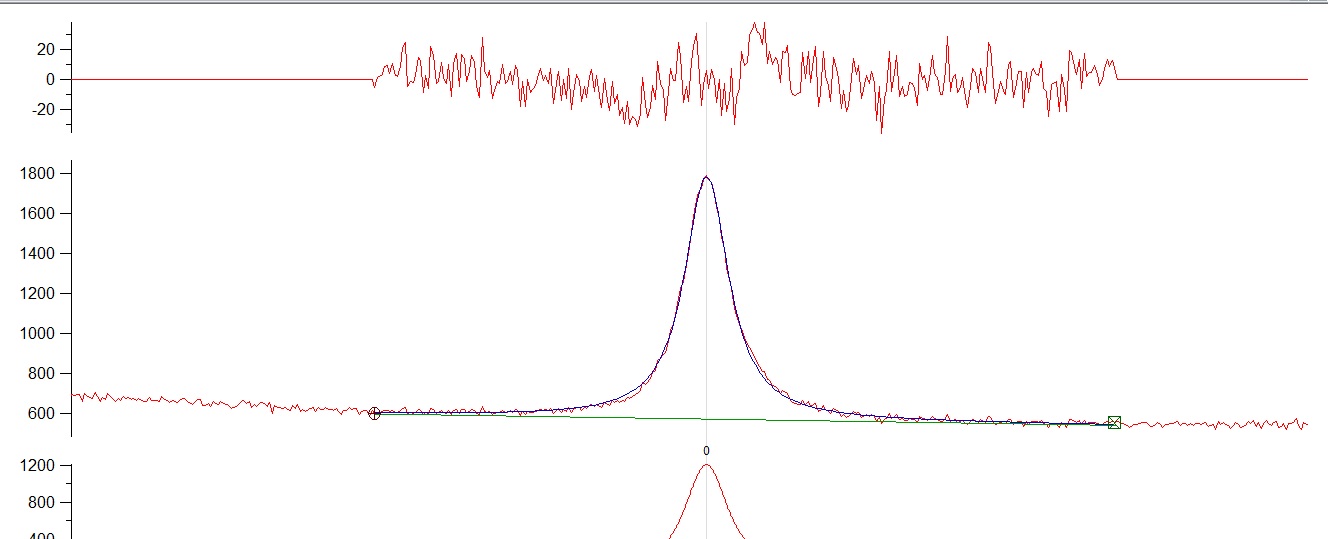
I have a single raman peak and i tried to fit a lorentzian and a voigt profile....I am attaching both fitting with their residuals. In the left part of the fitting there is a small trend in the residuals showing a slight inconsistency (or at least it looks like that). I am not expecting another peak so its a single fitting. Both fittings are quite similar with the voigt profile yielding a slightly better fitting. Does anybody have any ideas of this small inconsistency on the left part of the fitting or do you think its just nothing? Yhanks very much.
Konstantinos
I have been out of Raman for number of years, but did loads way back. There is not much to go on, but here are some ideas:
1. Do you have data from a reference sample that you *know* yields an ideal symmetric peak that fits to your line shape within the noise level? - this would provide evidence to rule out instrumentation effects.
2. Is you sample in the solid state? A slight asymmetry could be caused by internal stresses/defects within the sample. I have seen this type of thing with silicon (where one is limited to sampling near the surface due to the opacity of the sample - especially for short excitation wavelengths) and diamond (with deliberate asymmetric stresses, or with known defects.
I think I would need more information about your sample to speculate any further.
Hope this helps,
Kurt
May 15, 2017 at 05:49 am - Permalink
Thanks very much for your response......Actually this peak is related to the sulphate-oxygen stretching of free sulphate ions in aqueous sulphate. So essentially the specimen is just liquid (aqueous sodium sulphate).....It looks a bit assymetric but only slightly according to my eyes at least....I also considered a number of reasons but as far as i know from literature it is expected to be symmetric. I have a series of these spectra as a function of time and at the moment i fitted a lorentzian for all of them in a consistent way to see if there are any changes.
May 15, 2017 at 06:04 am - Permalink
One other idea that springs to mind is what is your x-axis? Is this in units of energy or wavelength? If you were to transform your axis would the peak then become (more) symmetric? In your literature, what axis units were used to report symmetrical peaks?
[edit]: This article may be relevant:
https://link.springer.com/article/10.1007%2FBF00972713?LI=true
Regards,
Kurt
May 15, 2017 at 06:33 am - Permalink
I do not think that it is instrumental because i have symmetric profiles from other liquid solutions....The axis is in wavenumbers and in general references are in the wavenumber scale. I hardly see any Raman spectra recorded in nanometers but i get your point....maybe the conversion induces this.....I guess there must be some kind of physical reason giving me this which i am missing at the moment.....What do you think about the amount of assymetry? I mean to me it looks quite subtle and this is why i am using Lorentzian (i also check the Voigt) to quantify intensities and areas. However, i do the same thing consistently for all my spectra to be able to compare if needed.
May 15, 2017 at 06:35 am - Permalink
* The fundamentals should drive the choice of peak shape, not the need to remove an empirically discovered residual by "fudging" the peak shape. Which peak shape best for the fundamentals?
* From the fundamentals of the probe -> event -> signal, Raman responses should/will give symmetrical response (peak) on the energy scale. This is the wavenumber not wavelength scale.
* The baseline below the peak is a straight line. The extension through the entire spectrum is not. What happens when you fit the baseline first to remove it to zero identically and then fit the peak? What effect does this have?
* When you fit a symmetrical peak of any shape (Gauss, Lorentz, Voigt) to an asymmetrical peak, you will always get a residual.
When all else is properly done (proper peak shape chosen and proper baseline removed), what is left must itself have a fundamental basis. The use of a PCA/PCR method may provide another option to discover whether this peak requires other components.
--
J. J. Weimer
Chemistry / Chemical & Materials Engineering, UAH
May 15, 2017 at 07:06 am - Permalink
May 15, 2017 at 07:29 am - Permalink
Try to fit a second peak on the 'left' side of your peak (x-axis is missing in the images). It's intensity could correlate with species like NaOSO3- or HSO4- (Check against the respective equilibrium constants...)
HJ
May 15, 2017 at 08:26 am - Permalink
The baseline is NOT linear across the entire spectrum. In this case, the sequence to fit a baseline + peak together is EXACTLY same as removing the baseline first and then fitting the peak because a linear baseline function has no dependence on the shape of the peak and peak fitting is co-addition (not convolution).
I suspect a major part if not all of the residuals arise because the wrong baseline is used.
What happens when you remove the curvature of the baseline to make it linear and then fit the peak?
--
J. J. Weimer
Chemistry / Chemical & Materials Engineering, UAH
May 15, 2017 at 08:42 am - Permalink
May 15, 2017 at 10:25 am - Permalink
You have two options. Method 1 is "brute force". Method 2 is the elegant (and possibly more rigorous) method.
Method 1
--
Fit just the background to a parabolic (quadratic) function over the range shown by the display. Use the cursors to exclude the peak region. Subtract the result from the raw data (and of course save this in a separate wave). Then, fit the resultant wave (with a perfectly zero baseline) to a peak of your choice.
Method 2
--
Modify the fit function to use a parabolic baseline + a Lorentz (or Voigt) peak simultaneously. Fit over a region that is as broad as your display.
I suspect the improper baseline function is the real problem. Your residual is NEGATIVE going, not positive going. This is a LOSS not a gain (of a new peak).
--
J. J. Weimer
Chemistry / Chemical & Materials Engineering, UAH
May 15, 2017 at 01:10 pm - Permalink
John Weeks
WaveMetrics, Inc.
support@wavemetrics.com
May 15, 2017 at 01:59 pm - Permalink
--
J. J. Weimer
Chemistry / Chemical & Materials Engineering, UAH
May 15, 2017 at 08:23 pm - Permalink
May 16, 2017 at 07:21 am - Permalink
The small difference in the area isn't surprising- the misfit using the linear baseline is pretty small. Consider the area under the residual curve compared to the area of the peak.
John Weeks
WaveMetrics, Inc.
support@wavemetrics.com
May 16, 2017 at 09:00 am - Permalink
--
J. J. Weimer
Chemistry / Chemical & Materials Engineering, UAH
May 16, 2017 at 02:40 pm - Permalink