Deformation on graph when log-scaled

tooprock
Fri, 03/13/2015 - 05:45 am
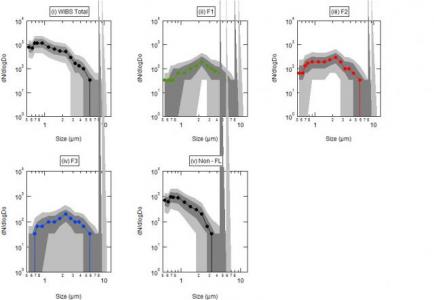
I have so called size distribution plots (dN/dlogDp). If I choose the y-axis as logarithmic the plot deformates. I've found out that the reason is the zero values in the data. On a logarithmic scale the values can't go below zero so I expect they are plotted on x-axis. Is there a way to owercome this issue? For now I just change those 0 values with 0.001. Any ideas?
Cheers,
Emre


I think it's unusual to apply the log scale to the Y axis. A size distribution can easily have bins with no counts, so plotting on a log Y axis doesn't seem like the right thing to do. Why did you want to do that?
A log X axis is quite common, as size distributions tend to follow a lognormal shape. A lognormal peak, when you plot it on a log X axis, has a Gaussian (that is, Normal) shape.
That prevents mathematical problems caused by log(0). But then you have another problem- is it justified to alter your data just for the sake of a graph?
John Weeks
WaveMetrics, Inc.
support@wavemetrics.com
March 13, 2015 at 02:21 pm - Permalink
Cheers,
Emre
March 16, 2015 at 06:59 am - Permalink
John Weeks
WaveMetrics, Inc.
support@wavemetrics.com
March 16, 2015 at 12:20 pm - Permalink
Wave sizeList = root:SizeBinList
Wave workedDistWave = root:workedDistWave
Make/O/N=(dimSize(sizeList,0)-1) sizeBins
sizeBins[0,dimSize(sizeList,0)-2] = sizeList[p]
Display workedDistWave[*][%Q10][3] vs sizeBins
AppendToGraph workedDistWave[*][%Q90][3] vs sizeBins
AppendToGraph workedDistWave[*][%Q25][3] vs sizeBins
AppendToGraph workedDistWave[*][%Q75][3] vs sizeBins
AppendToGraph workedDistWave[*][%median][3] vs sizeBins
AppendToGraph workedDistWave[*][%mean][3] vs sizeBins
ModifyGraph mode(workedDistWave)=7,mode(workedDistWave#2)=7,mode(workedDistWave#4)=4
ModifyGraph marker(workedDistWave#4)=19
ModifyGraph lSize(workedDistWave)=0,lSize(workedDistWave#1)=0,lSize(workedDistWave#2)=0
ModifyGraph lSize(workedDistWave#3)=0
ModifyGraph rgb(workedDistWave)=(8704,8704,8704),rgb(workedDistWave#2)=(8704,8704,8704)
ModifyGraph rgb(workedDistWave#4)=(0,0,0)
ModifyGraph hbFill(workedDistWave)=5,hbFill(workedDistWave#2)=4
ModifyGraph toMode(workedDistWave)=1,toMode(workedDistWave#2)=1
ModifyGraph mode(workedDistWave#5)=4,marker(workedDistWave#5)=19
ModifyGraph lsize(workedDistWave#5)=1.5
ModifyGraph log=1
ModifyGraph tick=2
ModifyGraph mirror=1
ModifyGraph standoff=0
Label left "dN/dlogDo"
Label bottom "Size (µm)"
SetAxis left 1,10000
SetAxis bottom 0.5,13
End
Cheers,
Emre
March 18, 2015 at 01:10 am - Permalink
- an Excel file
- a screen shot of a graph
- a screen shot of a procedure window
- a .ibw (wave) file
This happens so often that I need to know why it is, so that I can make my request clearer. I really want your experiment file (the .pxp file). It has all kinds of things in it that you may not think are important to me, but turn out to be key.
I have attached (a picture! of) the graph that I made from the waves you sent, by running the graphing commands from your procedure via the command line. It shows no spikes. You posted five graphs, some of which have huge spikes that cross into the upper graphs. So what you attached is not sufficient to reproduce the problem.
Please attach a copy of the Igor experiment file (the .pxp file) containing the data and the graphs with the problem in them.
John Weeks
WaveMetrics, Inc.
support@wavemetrics.com
March 18, 2015 at 09:59 am - Permalink
Cheers,
Emre
March 19, 2015 at 06:00 am - Permalink
Perhaps I should have waited on the Post Comment button, but perhaps you can appreciate my frustration, which is not just with you. I want to help, but I can't help if I don't get the information I need.
Perhaps also this issue should be taken up as support incident; we can guarantee that your propietary code and data will remain private. We never share information from tech support without the cusomer's permission. Send an e-mail to support@wavemetrics.com and we can take it up that way.
It's possible I don't need your code, just the graphs with the problem. You can save an experiment file with just the data and graphs to allow me to actually see and explore the problem.
John Weeks
WaveMetrics, Inc.
support@wavemetrics.com
March 19, 2015 at 09:24 am - Permalink
Cheers,
Emre
March 31, 2015 at 07:09 am - Permalink
---------------------
Wow. Plotting zero values on a log axis, with fill to next, and the next value is also zero on a log axis!
My initial reaction is to say that you are expecting a lot. On the other hand, since log(0) is -Inf, it seems like we should be able to avoid it. And having said that, the point where it would need to be detected is in some very complex code, and this is a truly pathological corner case.
I think the work-around you have already discovered is the right way to handle it: replace the zero values with something "small".
I have filed a bug ticket, but I have to say that it will probably be treated at low priority because of the unusual combination of problems.
---------------------
The spikes come from the fact that during the computation of the polygons to be filled, something results in +inf. I don't know where that comes from, since all the values involved are -inf (from the Log(0)). But, as you can imagine, a Fill to Next from -INF to -INF is not particularly well defined.
Thanks for the file- it helped a lot.
John Weeks
WaveMetrics, Inc.
support@wavemetrics.com
March 31, 2015 at 02:57 pm - Permalink