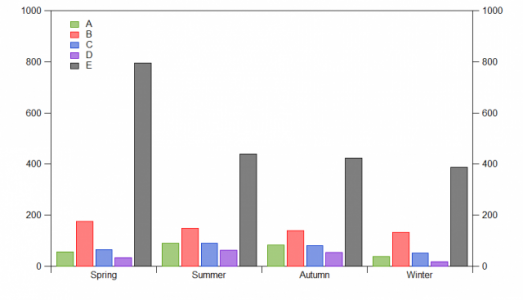
Error bar for category plot

tooprock
Fri, 01/24/2014 - 05:13 am
I have a category plot where the data are divided into four seasons of the year. In each season I have five parameters. I would like to put error bars (plus/minus standard deviation for each parameter) for each parameter in each season. When I try to use the error bars option in "Modify Trace Appearance" and choose constant, same error bars are places for different seasons. Is it possible to control it for each category? I attached the figure that I mentioned.
Cheers,
Emre


January 24, 2014 at 08:42 am - Permalink
Cheers,
Emre
January 24, 2014 at 09:00 am - Permalink