Waterfall Plot - Add Box, Grid and Background

ChrisZ
Thu, 01/23/2014 - 02:26 am
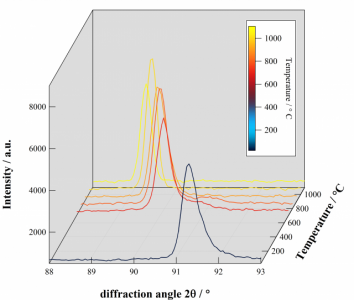
I would like to create a waterfall plot as it is shown in the attached image file. I have two questions regarding this:
The first question is, if there's a possibility to fill the x-y, x-z and z-y planes, when creating the graph. Ideally also with the option to add a grid on these planes. The grey areas as you can see them now are drawn manually.
If there's no possibility to shade the planes and add a grid via formatting the graph, it wouldn't be a problem to draw polygons and lines automatically. But for that I needed to know what exactly the paramter axlen in the "ModifyWaterfall" command is, which would be my second question. The description says "Relative length of angled y axis". As far is I understand it is only dependent on the length of the vertical axis but is not a simple fraction of it. (For example: If I use axlen= 0.25 the distance beetween start and end of the third axis (right) measured alongst the vertical axis is about 1/3 (of the veritcal axis). If I use axlen=0.8 its length is about 4 times the length of the vertical axis).
Can anybody help me?
Best wishes,
Chris


You have two options: Waterfall or Gizmo plot. It seems to me that you want the appearance of the 3D box which is easier to accomplish with Gizmo.
Shading the back planes of a Gizmo plot is controlled in the Axes object dialog. To see an example, open a demo experiment (File Menu->Example Experiments->Visualization->Intersecting surfaces) and double click on the Axes0 object in the display or Object list of the Gizmo0 Info window. In the resulting dialog choose the Grids & Planes tab, select XY Plane-Min Z from the Plane menu, check the Paint Plane box and click OK.
I hope this helps,
A.G.
WaveMetrics, Inc.
January 23, 2014 at 05:37 pm - Permalink