extracting 1D wave from contour

fermiliquid
Tue, 07/30/2013 - 07:43 am
I've posted this question on Igor list, but didn't really get what I was looking for, so here it is again:
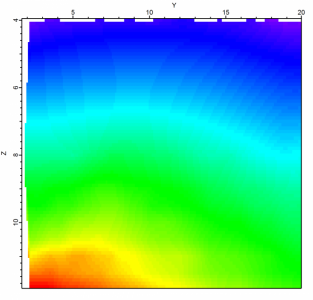
I have a number of files which contain 2 column data (X,Y) measured at some external parameter Z, which is constant in each file for each X and Y, but varies from file to file, Z < < X. When I want to visualize X(Y,Z) I can do so easily by making a contour plot of X,Y, and Z waves. ImageInterpolate makes nice image plot of concatenated waves X,Y,Z too, see attached image.
Now I would like to plot dX/dZ(Y,Z), i.e. a derivative of X with respect to Z for each value of Y and Z. Is there any way to differentiate M_InterpolatedImage with respect to 1 of its arguments? Perhaps extracting X(Z) for fixed values of Y, computing dX/dZ and then concatenating dX/dZ, Z, Y? Thanks!


At this stage you can use the x-sampling interval (say myXstartValue, myDxValue which you used with the /S flag of ImageInterpolate) to apply wave scaling to the extracted column zOfXandY0 using the SetScale command:
Given a properly scaled zOfXandY0 you can apply the Differentiate operation to get dz/dx as a function of x and y0.
I hope this helps,
A.G.
WaveMetrics, Inc.
July 30, 2013 at 10:23 am - Permalink
Does it mean that x is an implicit parameter? When computing the derivative the following command used and the argument is not specified?
Differentiate zOfXandY0/D=zOfXandY0_DIFDo I need to concatenate dz/dx, x, and y to make an image plot of dz/dx(x,y)?
July 30, 2013 at 01:58 pm - Permalink
I'm glad we are making some progress.
If you look at the Differentiate operation syntax you will notice that it takes a single "yWave" input. The documentation shows you that you can also provide (via /X flag) an xWave input but I did not suggest this option because in your application the x-intervals are constant (specified in the /S flag of ImageInterpolate). As such, the Differentiate operation obtains the x-values from the wave scaling and that is why I suggested that you execute the SetScale command.
Yes, that would be one approach. Another approach that you may use, if you are willing to throw out the top and bottom boundaries (i.e., at xmin and xmax), is to differentiate the whole wave at once. For example:
Differentiate ddd
Edit ddd
If you now throw out the first and last rows (e.g., using Duplicate/R) you get the full dz/dx without having to extract columns or concatenating the derivatives.
I hope this helps,
A.G.
WaveMetrics, Inc.
July 31, 2013 at 10:28 am - Permalink
August 2, 2013 at 05:56 am - Permalink