plotting solution(x,y,z) and freezing point on the same graph
schne643
Sat, 07/06/2013 - 09:26 pm
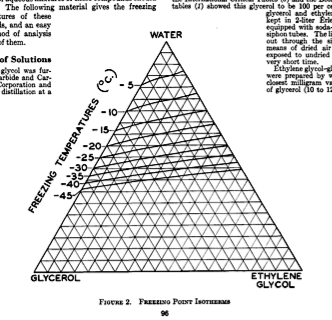
I would like to plot the melting points of three component mixtures (call them a, b and c) on a plot that also that shows the composition of the mixture. [an example point would be: a=0.8, b=0.1, c=0.1, Tm=20 °C]. I think the best way to do this would be to make a triangle plot sort of like the one shown in the attached figure, but aside from using gizmo (which i don't really think is the correct solution) i have no idea how to go about this. Any suggestions would be very helpful.
One thing I would like to try if I can figure out how to plot the 3-componet mixture is to either color code the freezing point values or make isotherm lines on the plot sort of like a contour map.
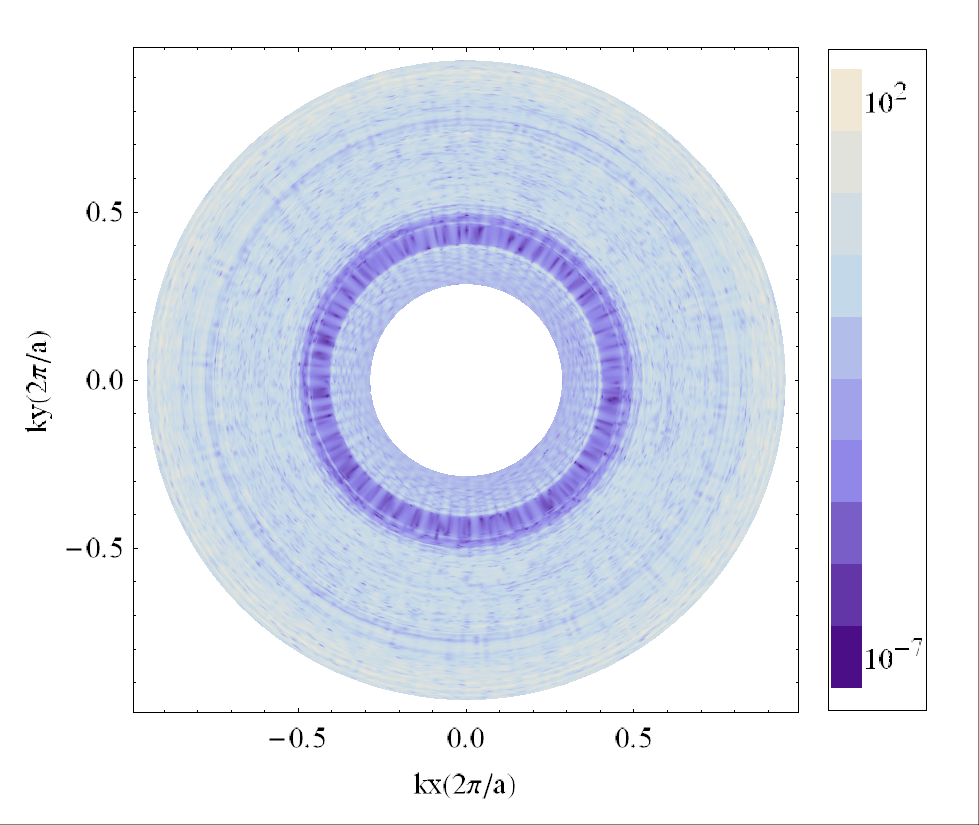
bz_0.png
freezing_point.png


July 6, 2013 at 10:22 pm - Permalink
July 7, 2013 at 05:48 am - Permalink