plot label and tick

oipunx
Fri, 05/10/2013 - 05:39 pm
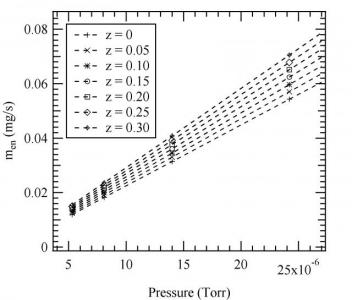
I'm new to Igor and I'm having a hard time trying to make the x-axis label on my plot to display engineering unit like 1E-6, 5 E-5, 1E-4, etc. I have looked at the "ticks and grids" tab and tried to switch between "engineering" and "scientific" but it cant get it to display how I wanted. It always shows 100x10^-6 etc... Also the x-y ticks are overlapping at the corner with my manual range setting, is there anyway to make it not overlap? I have attached an example here.
Thank you


Ach pooh! Why do you want to use computer language on a graph? I rant about this ugly mistake in labels to students as being Excel training-wheels for (ignorant) engineers who think the only one who might read their graph is another computer. It is verboten on graphs in quality journals.
http://prd.aps.org/authors/axis-labels-and-scales-on-graphs-h18
So, I hate to say that while I could probably help you figure out how to make this change in Igor, I won't as a matter of principle.
The difference between the two is solely in the powers of ten that appear on the decade scale ...
http://en.wikipedia.org/wiki/Engineering_notation
You will need to change one or all of three things to get this to work ...
* Auto/Manual Ticks ... number of ticks
* Axis ... axis standoff UNCHECKED
* Ticks & Grids ... outside rather than inside
Here's my cleaned up presentation your graph.
EDIT: On a less biting note ...
The intent of a graph is to show the data as clearly as possible. My concern is, your graph hides the data behind too many adornments. You can get to the above far clearer graph by simple steps such as: eliminating the legend in favor of a figure title + annotations and using unit scaling on your x-axis.
Apologies otherwise ... my comments are not directed at you as a personal attack, rather out of general frustration whenever I see such bad habits.
--
J. J. Weimer
Chemistry / Chemical & Materials Engineering, UAHuntsville
May 11, 2013 at 05:29 pm - Permalink