the y axis is crossing x axis. how to make them just connected?


pangeng
Thu, 08/14/2014 - 12:15 am
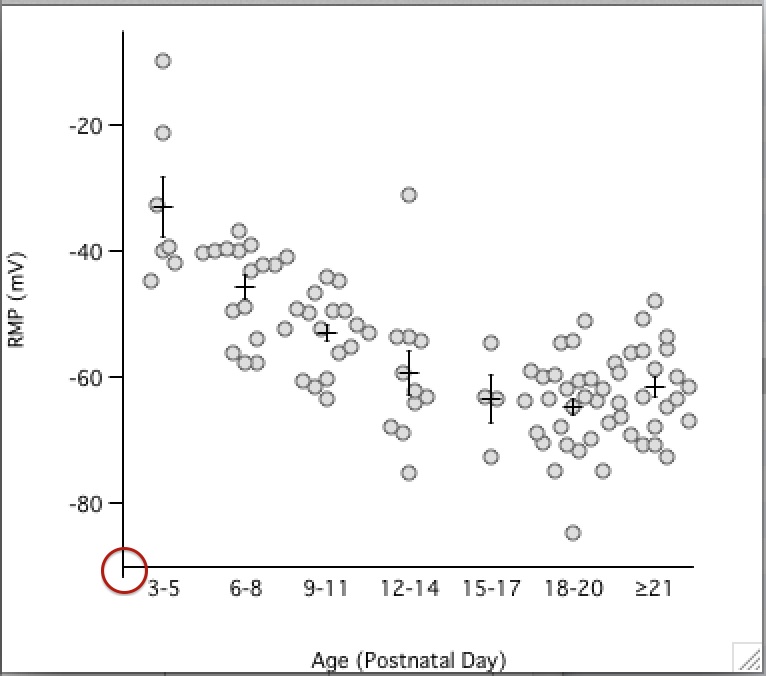
the problem is that y axis is crossing x axis as shown in the attachment. How to make two axises just connected each other?
thanks.
--Jim Prouty
Software Engineer, WaveMetrics, Inc.
August 14, 2014 at 01:32 pm - Permalink
thank you Jim. However, it doesn't work.....
this code disappeared the tick but not the one at "0"
BTW the axis is named category_bottom
August 14, 2014 at 07:19 pm - Permalink
ModifyGraph standoff=0--Jim Prouty
Software Engineer, WaveMetrics, Inc.
August 15, 2014 at 03:44 pm - Permalink
Great Thanks.
I am reading ModifyGraph.
August 15, 2014 at 11:16 pm - Permalink