Wave

bella
Sun, 11/17/2013 - 03:20 am
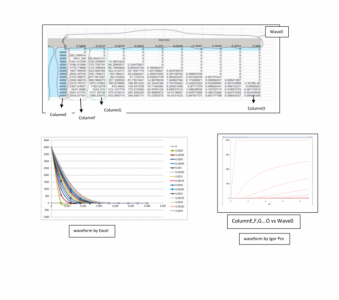
i made one wave in excel(.Xls) but with the same numbers i did it with Igor pro but i had another waveform. i repeat the operation many times and i had the same result. please help me to find the mistake.
I show the difference of the wave in attachement.
Thanks .
Bella


You have to explain better what you do. It is also hard to read anything on theses figures.
How is your data organized in Igor? Do you copy and paste the data from Excel into Igor or do you load a file?
November 18, 2013 at 07:25 am - Permalink
Bella
November 18, 2013 at 10:57 pm - Permalink
I does not make sense to me that you are plotting (in Igor) column data (E, F, G, O) vs row data (wave0).
I suspect that in excel your plot is Column F, G, ... O all vs. column E with the labels for each dataset being the row data (wave0), or various row data vs top row (wave0). I cannot see the numbers in your image to work out what.
Hope this helps!
November 19, 2013 at 12:08 am - Permalink
Thanks for your help it's you're recht,
i corrected its but i have another problem:
My Function is Z=f(x,y) with your help i made a 2D waves and made a Contour plot(see II-14,Manuel Igor). Yet i would like to plot Z=f(x) and Z=f(y) separately, that means from 2D to 1D(not sure only my imagination).
my question is how can i plot them ( f(x) and f(y) ) based to Z=f(x,y)?
thanks
Bella
November 22, 2013 at 04:01 am - Permalink
You can plot each row or column of a 2D wave by the following (say your 2D wave is named wave0)
appendtograph wave0[1][] //append row 1
display wave0[][0] // display column 0
appendtograph wave0[][1] //append column 1
note that since these are from the same wave, the trace names on the graph will be wave0, wave0#1, wave0#2, etc. It is up to you to remember which is which.
November 25, 2013 at 06:41 am - Permalink
i apologise myself for my english. but i have to do this with Igor Pro so i don't have another choice. the Mistake come from my explanation.
so i explane all yet:
i want to trace, studie one PDE with Igor Pro (i am very very new in Igor) firstly i just see the explanation of ODE in Igor manuel and i try another way by solving the PDE with finite differenz(numerical solution) and made a table von this solution(with finite differenz) in Excel, then i loaded it in Igor like 2D wave because my fonction is Z=f(X,Y).
yet i want to make a Contour plot of this 2Dwave that means with the fonction "display;AppendMatrixContour Z vs {X,Y}" (Z ist the matrix, X,Y are restectively xdata, ydata) for exemple. i make the 1D wave von xdata, the 1D wave von ydata. when i write the fonction display;AppendMatrixContour Z vs {Xdata,Ydata}
i become this error: Contour of'Z': Xdata,Ydata wave are not monotonic. it will be ignored.
i would like to know how can i do at this moment. concerning the definition of monotonic i just know that the fonction is monotonic when for all x,y ;x<=y then f(x)<=f(y).
or can You help me with another way to solve the PDE in Igor?
by anticipation i thank us.
bella
November 26, 2013 at 06:17 am - Permalink
how can i plot the fonction which look like a usual fonction (1/x, 1/x*x,)? for exemple i want to plot a fonction f(t)=A/t where A is a constant and t a variable; this fonction look like a usual fonction f(x)=1/x. i ploted easily the fonction 1/x but i can't plot the fonction A/t. is it because Igor confuse my t variable with its t(t fonction for the current chunk in multidimensional wave)or what? please help me.
Bella
December 3, 2013 at 06:06 am - Permalink
I suggest you read up about wave scaling and the 'special' symbols x,y,z,t,p,q,r,s that are used for wave indexing. For example, type this into the command line:
DisplayHelpTopic("Multidimensional Waves")
There are many ways of doing this, but I use a convention of having all my variable names beginning with 'v' (and string names begin with 's') and waves begin with 'w'. A piece of code that may help you is as follows:
Make/O/N=39 wData , wData2
SetScale/P x 1,0.1,"", wData,wData2 // starting value 1, delta 0.1
wData[]=Recip_T(50,x) // A / t
wData2[]=Recip_T2(50,x) // A / t^2
Display wData, wData2
End
Function Recip_T(vA,vT)
variable vA, vT
return (vA / vT)
End
Function Recip_T2(vA,vT)
variable vA, vT
return (vA / (vT * vT))
End
Just type Test() in the command line and it will create the data and plot a graph.
Hope this helps,
Kurt
December 3, 2013 at 06:46 am - Permalink
Plotting the results can be done in a number of ways depending on what you want. A contour plot with an appended image will give a 2D view of the data. A Gizmo plot will create a 3D image from the 2D wave (x,y,z). Or you can plot each column (different values for A) as individual traces on an XY graph (following my previous post instructions).
December 3, 2013 at 06:51 am - Permalink
If you execute this command:
DisplayHelpTopic "Synthesizing Data"
Igor will show you the part of the Guided Tour that does something similar to what you want to do.
For more details:
DisplayHelpTopic "Function Plotting"
John Weeks
WaveMetrics, Inc.
support@wavemetrics.com
December 3, 2013 at 09:49 am - Permalink
i understood besser.
i'd already do all guide Tour of Igor but i didn't understand all kapitel.
So thank you again.
Bella
December 4, 2013 at 06:40 am - Permalink