Should Histogram with data over several orders of magnitude Normailse ?


Mike German
Mon, 10/02/2023 - 05:20 am
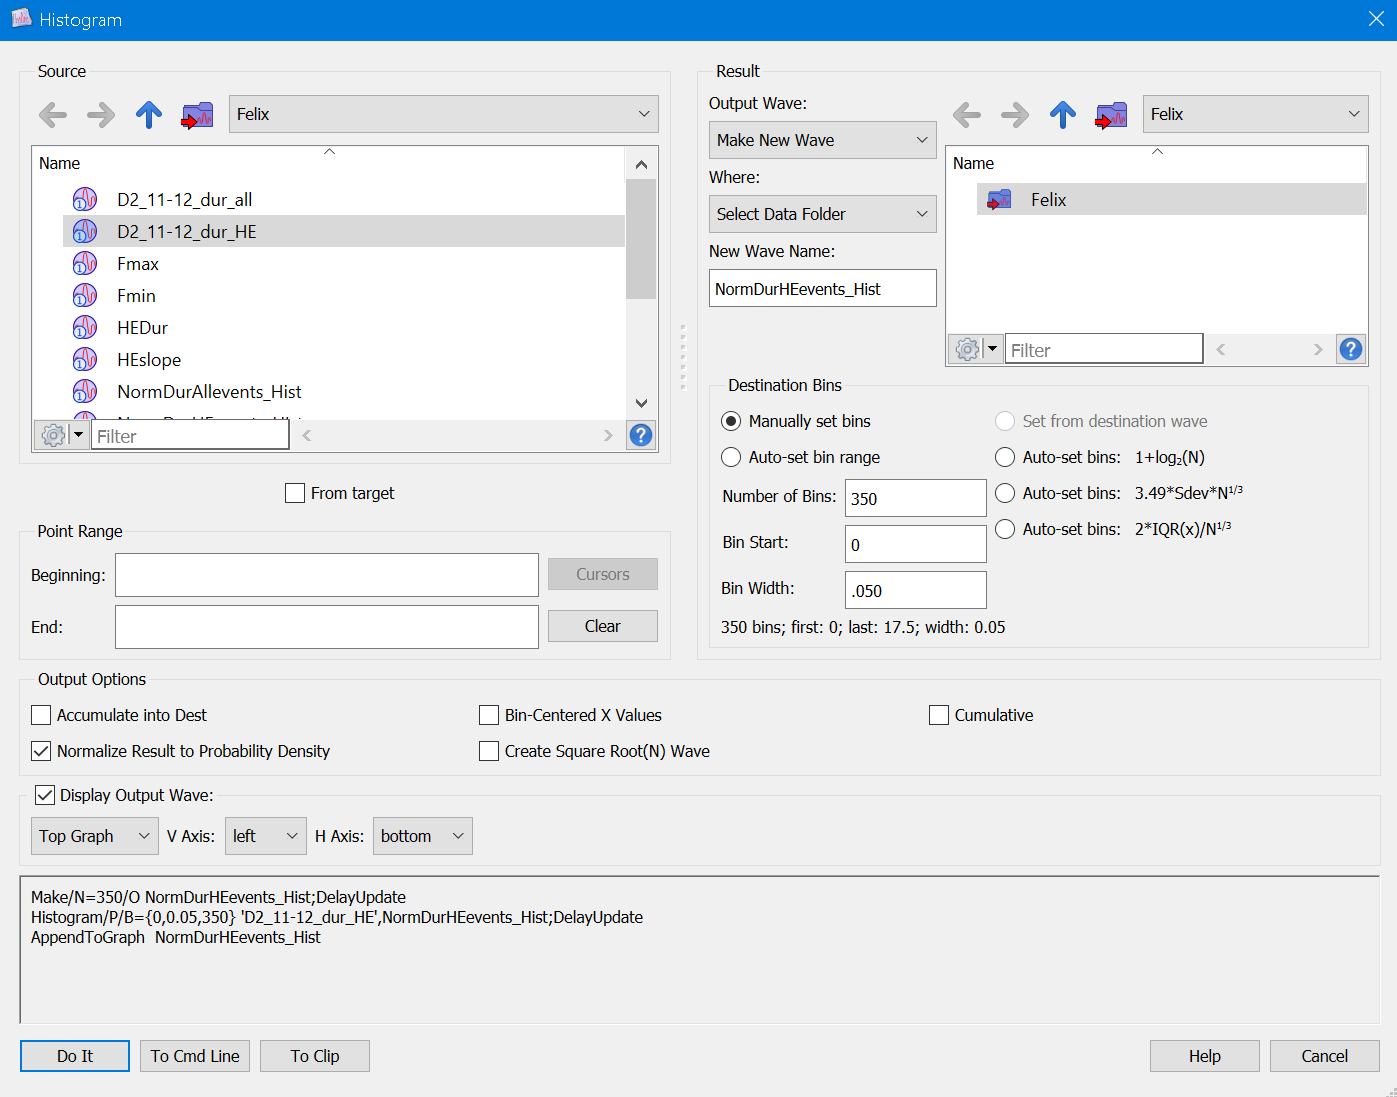
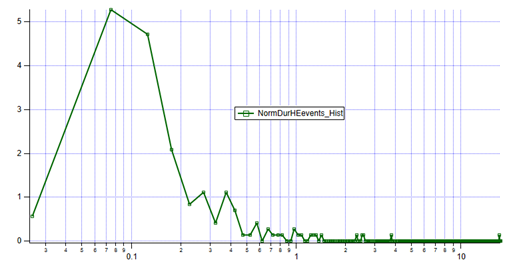
I'm trying to generate a normalised histogram of event times ranging from 0.05 to 17.5 second with some 144 points, using the analysis menu as shown in the image. The resulting histogram has values >1.
I must be doing something silly ... but what?
As the dialog says, it's normalized to probability density, i.e. the area under the curve (assuming rectangular bins) is one.
October 2, 2023 at 06:36 am - Permalink
Yep ... Silly!
October 2, 2023 at 06:52 am - Permalink