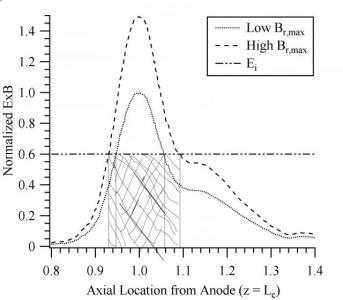
shade under curves

oipunx
Tue, 05/07/2013 - 09:01 am
I have made a plot of 3 different curves and Im trying to shade the area under the curves where the horizontal line intersect the other 2 curves. It should be shaded so that if it's under the larger curve, it has a different pattern than the smaller curve. I have an example of what it should look like in the attached jpeg file. I have read the manual but couldnt figure out how to do this so any help would be greatly appreciated.
Thank you.


May 7, 2013 at 09:38 am - Permalink
WAVE wBig, wSmall, wBound
duplicate/O wBound, shadeBig, shadeSmall
shadeBig = wBound*(wBound<=wBig)
shadeSmall = wBound*(wBound<=wSmall)
end
Note the use of logical waves to define the shade regions. The waves shadeBig and shadeSmall were appended to the graph, and Fill To Zero mode was selected for each. Finally the Reorder Traces... was selected from the Graph menu to give the displayed result.
May 8, 2013 at 09:59 am - Permalink
May 8, 2013 at 07:46 pm - Permalink