Scaling of Image plot (2D wave) from 1D wave


vodicka
Tue, 04/20/2010 - 02:43 am
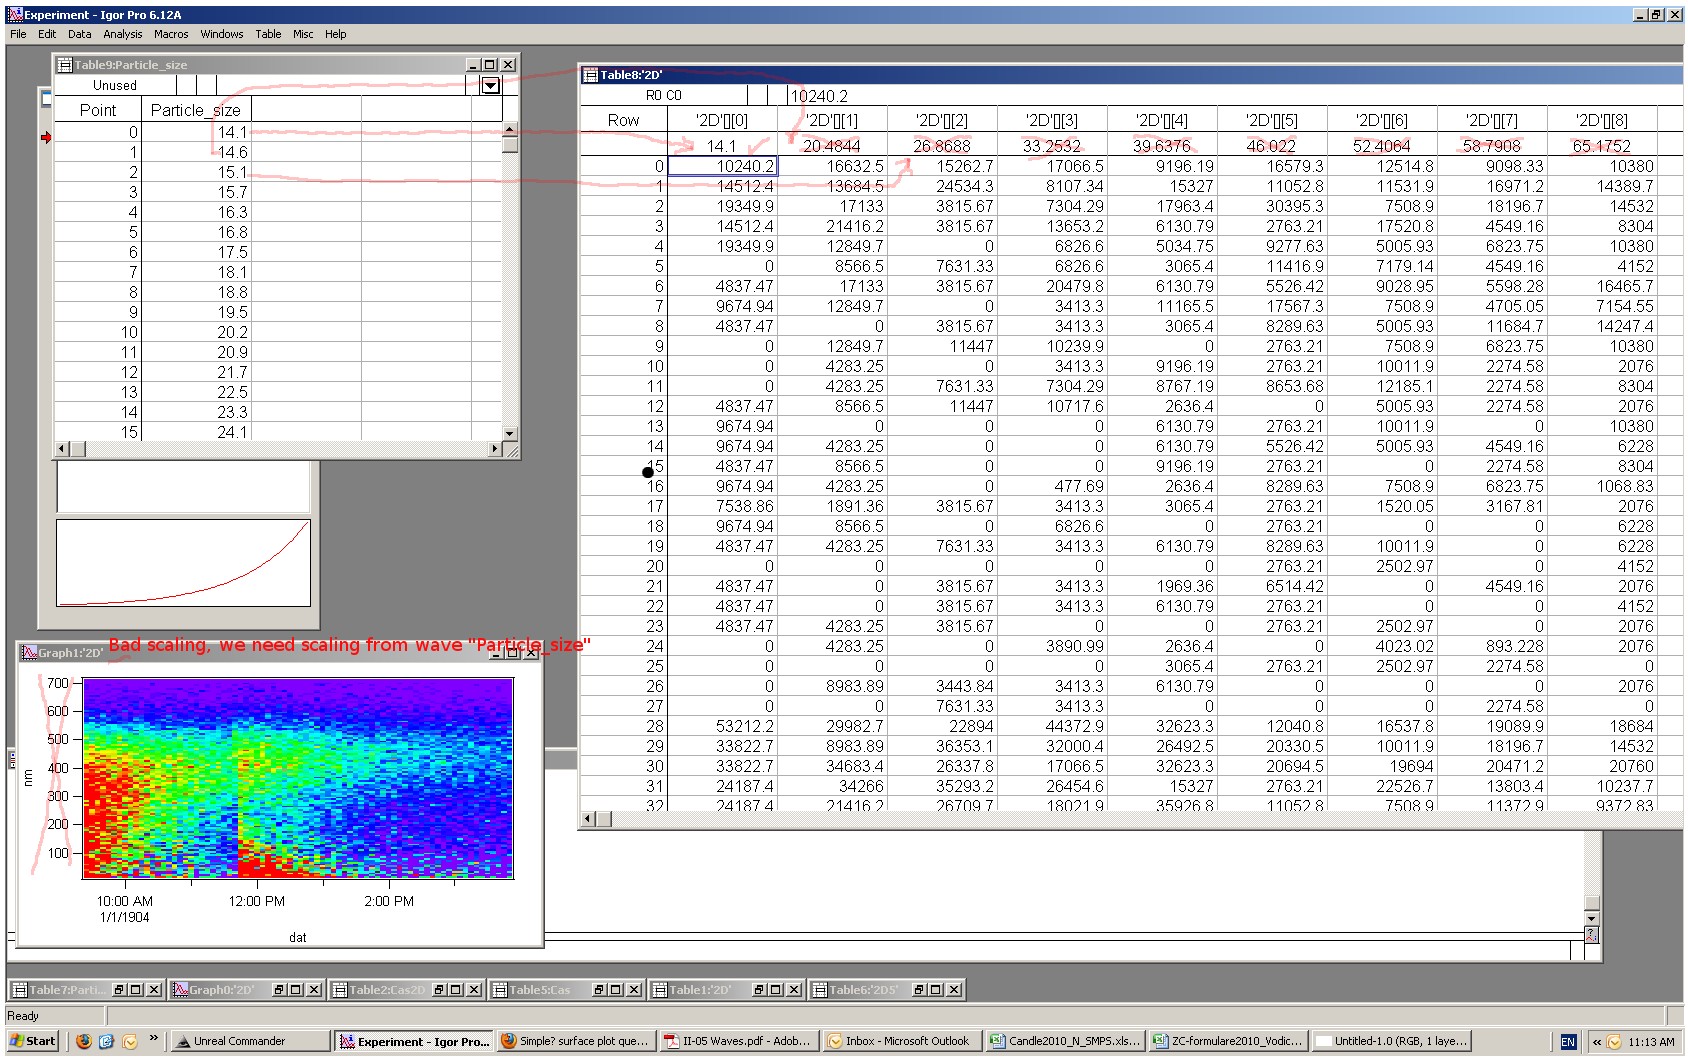
I am Igor begginer but after several hours I am not able to solve my problem, which is perhaps not so difficult. I need make an Image plot where is axis scaling set from 1D waves. In manual I found there is possible change scaling in Data->Change Wave Scaling... but there I dont see the possibility "set scaling for axis from other wave".
So, I have 2D matrix of data and for each column I need set value from other 1D wave. Have anybody some idea how can I do it? I am not sure if my question is clear, so I make screenshot here: http://pixarium.net/igor-screen.jpg
Thanks in advance.
appendimageoperation. The 1D wave has to be 1 point longer than the corresponding dimension of the 2D wave, because the boundaries of the pixels are taken into account.You have to use something like:
display; appendimage imagewave2D vs {*,wave1D}Execute
DisplayHelpTopic "appendimage"for details.FYI: The scaling of a wave is an intrinsic property of the wave itself and not of a graph or even an axis.
For more information about this execute:
DisplayHelpTopic "The Waveform Model of Data"April 20, 2010 at 06:03 am - Permalink
April 20, 2010 at 06:04 am - Permalink
I guess what you want to establish is not possible.
Suppose the 1D wave that defines the pixel boundaries in your image plot is calculated like this:
wave1D = 2^pthan you get pixel of equal size by checking the log checkbox, but as far as I understand you correctly the 1D wave itself is calculated with a logarithmic dependence. To show equal-sized pixels for this case would require something like an exponential mode.April 20, 2010 at 06:39 am - Permalink
Well, I had dummies about this problem yet and perhaps I may say it is not impossible ;-) In attached file is several screens with my solution. Perhaps it is not clear solution but it is functional ;-)
Petr
April 29, 2010 at 08:48 am - Permalink
Another way is to create a 1-D wave with one more point than columns, and assign exponential values to it, and use that to provide the Y coordinates when you use AppendMatrixContour.
Make/O/N=(10,10) twod=p*q
Make/O/N=11 yvals= exp(p-2)
Display /W=(210,64.25,626.25,407)
AppendImage twod vs {*,yvals}
ModifyImage twod ctab= {*,*,Grays,0}
ModifyGraph log(left)=1
ModifyGraph mirror=2
End
--Jim Prouty
Software Engineer, WaveMetrics, Inc.
April 29, 2010 at 09:27 am - Permalink
March 10, 2017 at 10:58 am - Permalink