Multiple scattered plots in a 3D plot


andrea
Mon, 10/22/2012 - 03:38 pm
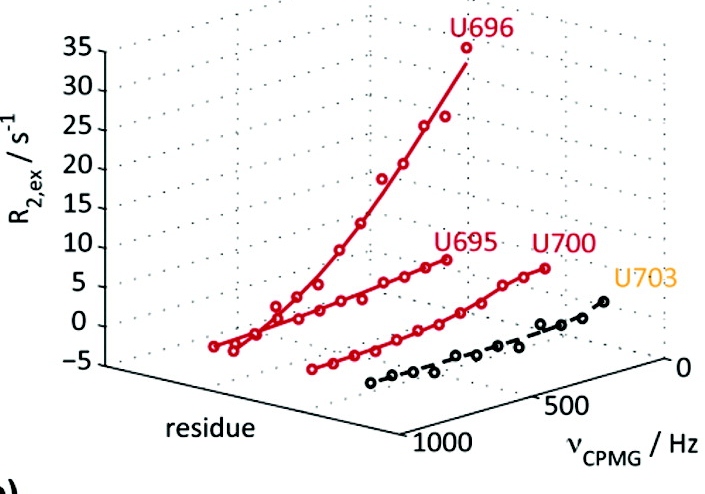
I have a question while generating a 3D plot. I have five 2D plots each consisting of several points with an error associated to them in addition of a curve fit, specified as a separate wave each. Total I have x and y wave, fitwave, and error bars waves. I want to generate a 3D plot for this 5 curves as is displayed in the attached curve. I was wondering what is the "best" way to deal with this issue. I have tried gizmo scattered plots, but I cant add the error bars to each point.
Thanks in advance
This is illustrated in
Igor Pro Folder -> Examples -> Visualization -> Advanced: Scatter Arrows.pxp
which you can use as a prototype.
Your case should be simpler because all the error bars presumably have a common orientation along the z-axis, so you shouldn't have to provide a rotation wave. Depending on how your error bars are generated you may need a wave (or waves) to give the error-bar marker size(s). These options can be seen by double-clicking on the scatter0 object in the GizmoInfo window of the above Example pxp. This will open an information window for that scatter object (which will be replaced by one of your data scatter objects).
October 23, 2012 at 03:27 am - Permalink