Liquid scintillator panel ignoring histogram data
Hart43
Thu, 09/15/2016 - 10:12 am
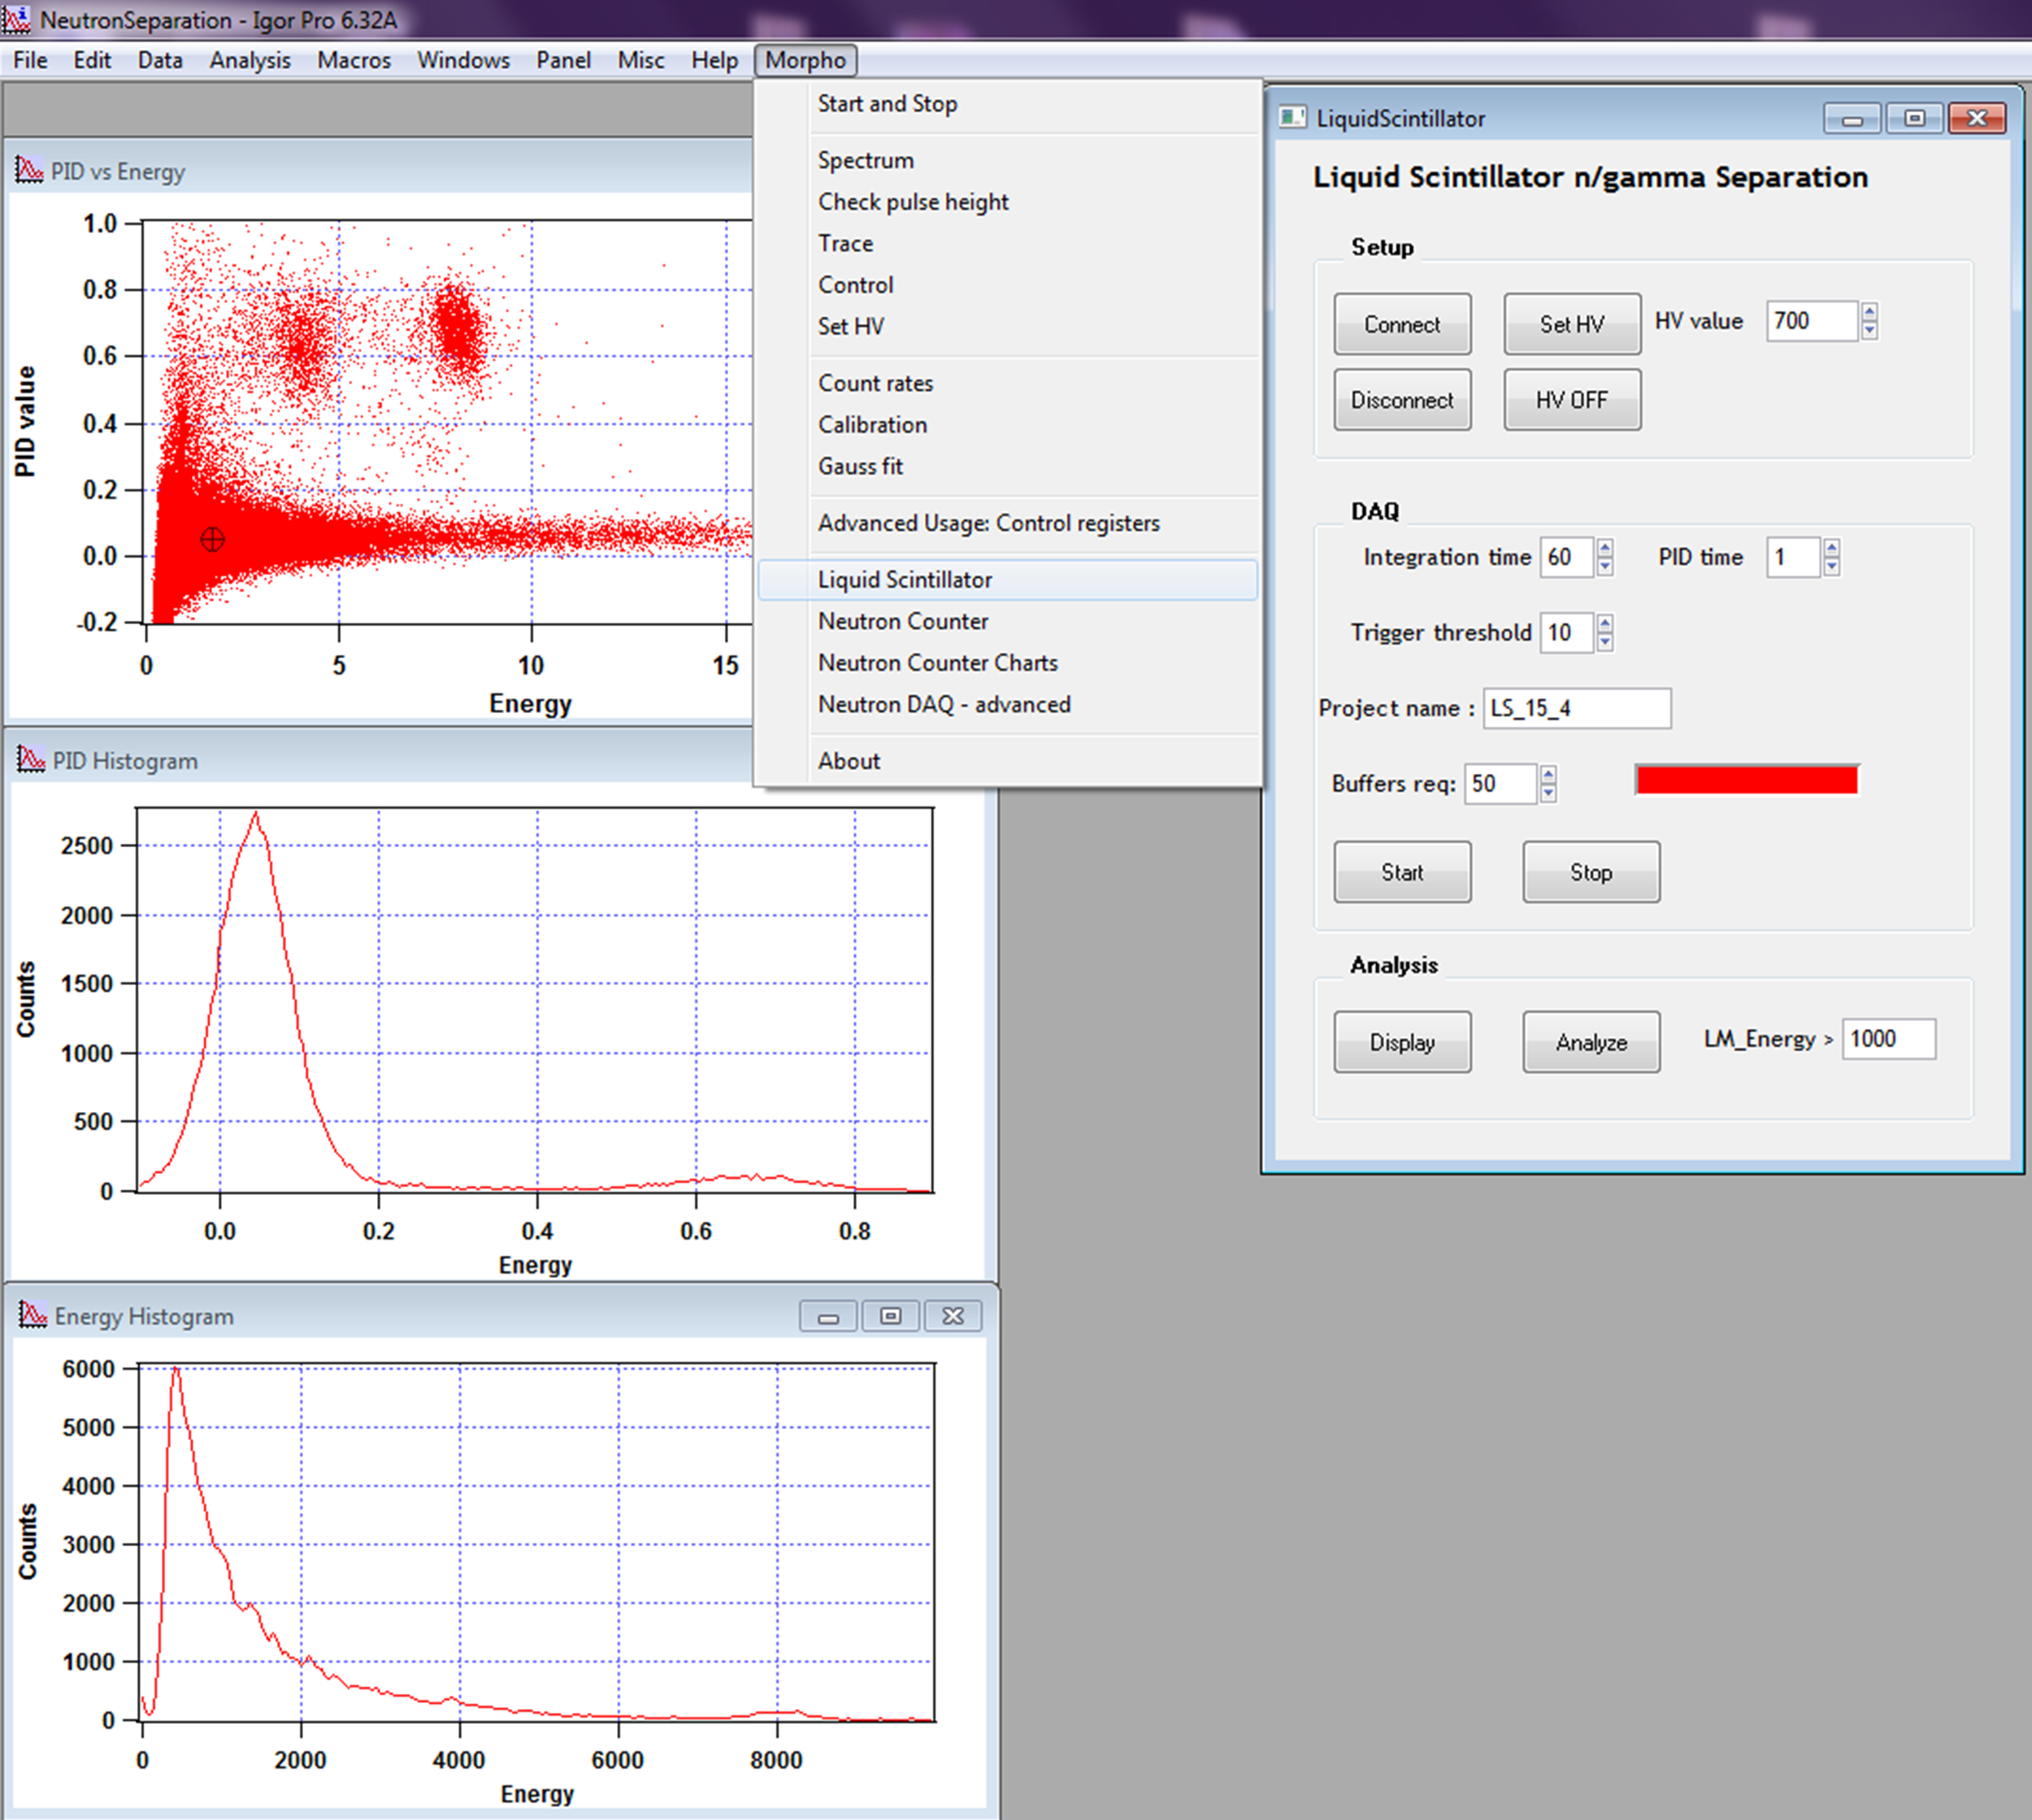
I've been using IgorPro and eMorpho for data acquisition and processing. Measurements are collected using the Liquid Scintillator panel under the Morpho menu and saved as .bin files. Unfortunately there's a problem when trying to look a the collected data. The software will automatically generate the three plots in the attached image for each bin file. The data in the PID vs Energy figure displays roughly 136 thousand individual points plotted as the PID wave vs LMenergy wave. The Energy Histogram however only shows data for the first 200 "energy" bins, and the EHisto wave used to generate the data is cut so it doesn't provide data beyond the 200th bin. Is there a way to prevent Igor from cutting off the EHisto wave at only 200 bins?
Any help is appreciated!
Jessica
LiqScin.jpg


It appears that eMorpho doesn't know about Igor. How do you get the data into Igor?
John Weeks
WaveMetrics, Inc.
support@wavemetrics.com
September 15, 2016 at 04:22 pm - Permalink
Usually we import the data from the bin files using the analyze option on the Liquid Scintillator panel. I found the issue in the procedure window for the Liquid Scintillator panel though. For some reason it was pre-set to only show the first 200 bins rather than the full wave which has 10000 points. Changing the highlighted line to use the full 10000 solves my problem.
September 16, 2016 at 09:40 am - Permalink
John Weeks
WaveMetrics, Inc.
support@wavemetrics.com
September 16, 2016 at 01:08 pm - Permalink
September 19, 2016 at 08:41 am - Permalink