How to correctly do a curve fitting

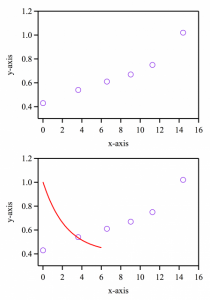
I am trying to do an exponential fit for a x and y dataset (see attached Figure, upper one). I used the exp (or exp_XOffset) function under "Analysis"--"Curve fitting" and got something weird (se attached Figure, lower one). Did I use the wrong function or? Or is there a way to simply draw a line (y=0.4 exp(0.05x)) manually?

Thanks!!
You are trying to fit a growing exponential (an exponential with negative decay constant). The auto-guessing routines can't handle that, you need to select Manual Guesses on the Coefficients tab of the Curve Fit dialog and enter your own guesses in the Coefficients list.

John Weeks
WaveMetrics, Inc.
support@wavemetrics.com
Ok. I thought it was easier. Thank you! Still want to know, is there a way to simply draw a line (y=0.4 exp(0.05x)) manually on the figure?
shen2 wrote:
... Still want to know, is there a way to simply draw a line (y=0.4 exp(0.05x)) manually on the figure?


make/N=160 ewave
SetScale/I x, 0,16, "", ewave
appendtograph ewave
ewave = 0.4*exp(0.05*x)


--
J. J. Weimer
Chemistry / Chemical & Materials Engineering, UAHuntsville
Quote:
Is there a way to simply draw a line (y=0.4 exp(0.05x)) manually?


Make/O/N=200 demo
SetScale x 0, 16, "", demo
demo=0.4 * exp(0.05*x)
Display demo


For details execute
DisplayHelpTopic "Function Plotting"