Help with a 2D Histogram

Anna135
Tue, 08/05/2014 - 12:30 pm
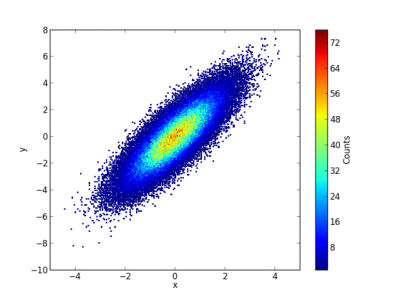
I have been trying to construct a 2D histogram, and all went well until I attempted to display it in an image.
For some reason it is not scaling correctly. I had copied and pasted the code from the 2D Histogram page.
Here is the other snippet of code, which I've been using to call the function I coped from igorexchange.
//Histogram...
wave Apr11_wv100_1, Apr11_wv100_2
make/D/O/N=(50,75) Apr11_wv100_Hist12
JointHistogram(Apr11_wv100_1, Apr11_wv100_2, Apr11_wv100_Hist12)
Display/N=Apr11_wv100_Hist12; AppendImage Apr11_wv100_Hist12
ModifyImage Apr11_wv100_Hist12 ctab= {*,*,Spectrum,0}
ColorScale/E/C/N=NumberNeutrons
AppendtoTable Apr11_wv100_Hist12
end
I have been playing around with the number of rows and columns for the "Apr11_wv100_Hist12" matrix
hoping that it will in the end look like the attached picture. The original data waves that are creating the matrix are 8640 rows long.
Any help would be appreciated!
Thank you.


ctab= {*,*,Spectrum,0}part. The asterisks indicate that the colour scale will go from the minima to the maxima, you need to change the first asterisk to >0 (maybe 1? depends on your data). I think it should bectab= {1,*,Spectrum,0} minRGB=NaN,maxRGB=0August 5, 2014 at 02:03 pm - Permalink
The problem with my program is the the matrix that I created in order to make the histogram is not scaled correctly. I am having trouble understanding the right combination of rows to columns (in the size of the matrix) that will show the data in the way that the attached picture does. (see my first post for the picture).
The original graph of the data looks similar to the picture I attached, and I need the histogram I am making to reflect that data. However the information on the color scale was very helpful, thanks!
August 6, 2014 at 06:57 am - Permalink
#include <Bivariate Histogram 2>Now you have a more intuitive menu for creating your 2D histogram from the macros menu. Apologies if you've tried this already. Hope it helps.August 6, 2014 at 09:51 am - Permalink
You seem to use the following snippet: http://www.igorexchange.com/node/1373
Note that the documentation says: "The result will be placed in the wave 'hist', which must be made beforehand and scaled to determine the histogram binning and boundaries"
Your code above does not include any scaling, such as e.g.
setscale/i y,20,100, Apr11_wv100_Hist12
You must derive the numbers from your data.
August 7, 2014 at 09:52 am - Permalink