Fill to next on a Polar graph


J-E Petit
Tue, 04/21/2015 - 02:55 pm
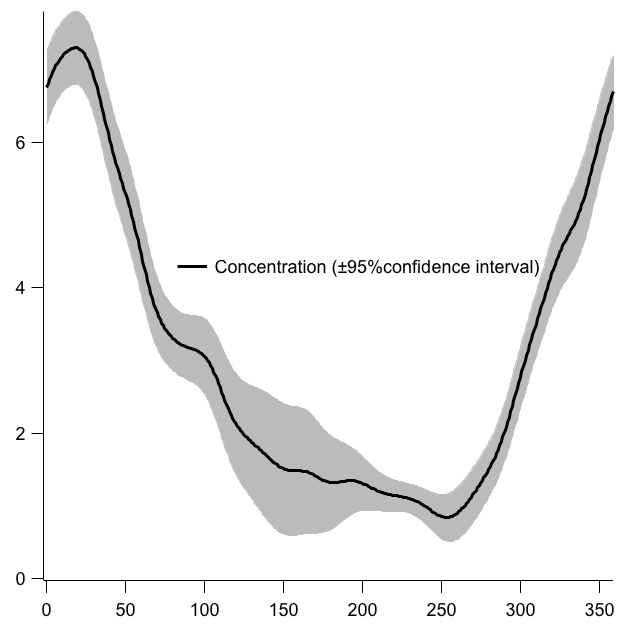
I'd like to display a 1D wave (called E_mx), as well as its 95% confidence interval (so 2 1D wave called E_mx_up and E_mx_down), on a polar projection.
The regular graph (cartesian coordinates) give something very satisfactory using "Fill to next" for the E_mx_down trace. See image attached.
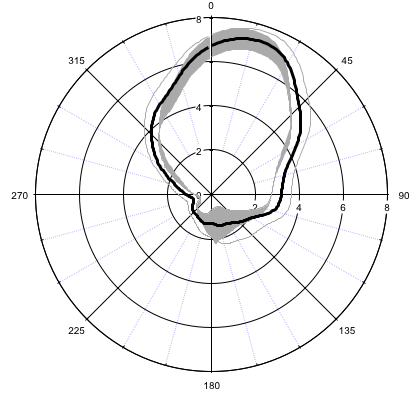
But whenever I try this on a polar graph, it doesn't do what it's supposed to do (or what I want it to do). Also see image attached. I thought it was a problem of trace order, but it doesn't have any impact.
Any hint?
Thanks!
J-E
If you can create an xy pair of waves encircling the area, you can use DrawPoly.
Good idea for a new feature, also.
Larry Hutchinson
WaveMetrics
support@WaveMetrics.com
April 23, 2015 at 11:48 am - Permalink