Dynamical correlation between two graphics possible ?


Djebulon
Tue, 02/04/2014 - 04:04 am
I'm an Igor newbie and I want to duplicate a function of another program (developed in C) in my data analyzing in Igor.
Initialy I have a 256x256 .tiff image.
With simples equations I extract in Igor from this image 2 maps :
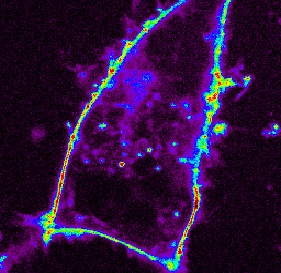
1 map of Itensity and
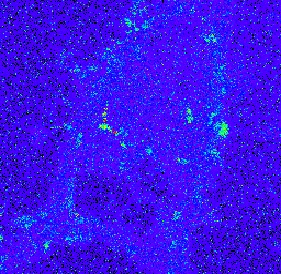
1 map of Brightness.
Each of them are 256x256 waves (see attached images) and are displayed in the main window.
I vectorized the maps information (instead of 2D[256][256] waves I create 1D[65536] waves)
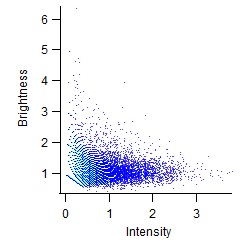
I plot the Brightness vs Intensity for the vectorized maps and I displayed it in the same window.
I want to know if there is a possibility to obtain dynamicaly a visual correlation between a region of the "VerSus graph" and the corresponding pixels in the images of the maps.
The square representation is the ideal display I would want to get but it's not restrictive.
As I don't really know how to ask to Igor to re-lauch a "function" (/proc/macro) each time the mouse is acting in the graphic, the only thing I managed to program is a non-dynamical defininition of a region (with 4 setvariable) and with a "button" to lauch a function.
The function just checks the value of the brightness and of the intensity and creates a mask to change the pixels in red.
It's very time consuming.
Does anyone know if it's possible to ask to Igor to maintain the execution of the program in a "waiting" state in order to lauch a loop when interacting with a graphic ?
Thank you very much
The attached files are :
01 - The Intensity map
02 - The Brightness map
03 - The Brightness versus Intensity graphic extract from the 2 vectorised maps
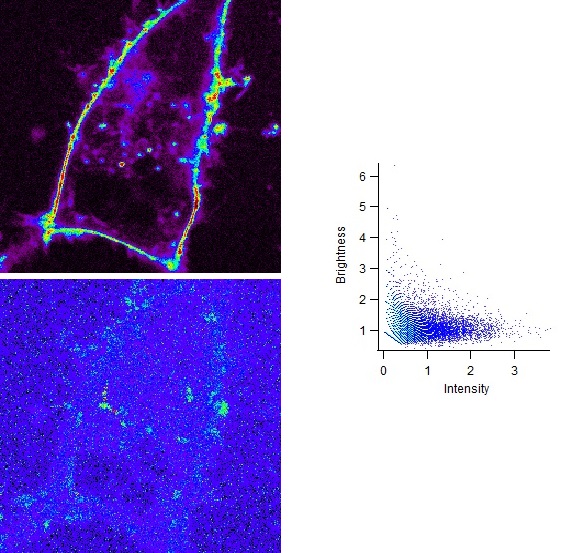
04 - The display of the window with the 3 elements.
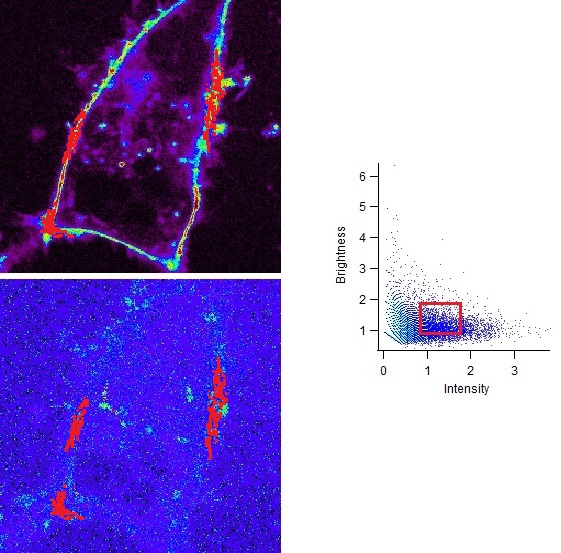
05 - Example number one of the correleation between a defined square of pixels of the Versus Graph and the corresponding pixels in the 2 maps
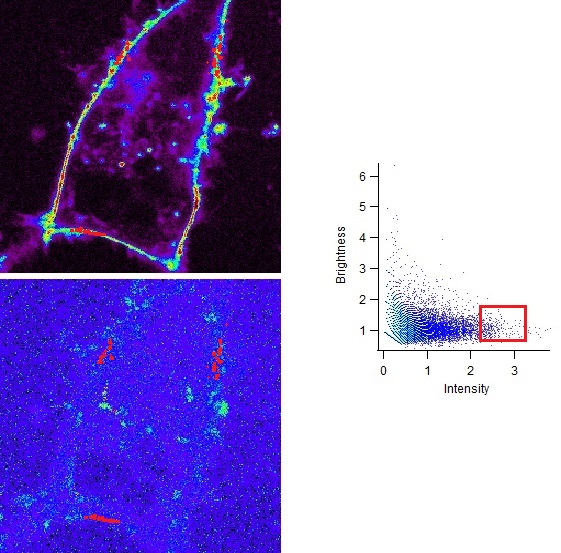
06 - Same example but with the square moved to the right.
07 - Igor project with the differents waves.

- Redimension both maps from 2D into 1D
- Create a bivariate Histogram (see e.g. http://www.igorexchange.com/node/4651). Here my approach is that the bin size for the histogram is always 1 count (of intensity)
- Plot histogram as NewImage
- Then I use a region of interest (ROI) tool (under image analysis) to select an area on the histogram (see picture), which means creating a mask with 1 for "within the ROI" and 0 for outside
- After multiplication of the mask with the histogram I am left with pairs, say X and Y, of intensities of two elements
- Now the task is to find the pixels in the initial 2D images where X AND Y counts occur. This is simplified by using a Cantor pairing function to generate one unique integer out of two: http://en.wikipedia.org/wiki/Pairing_function
- now the XY pairs from the histogram and the two 2D maps are "cantored"
- then I need to find the correct Cantor values. For this I got input here: http://www.igorexchange.com/node/5447 , although my final version differs from what I wrote back there
All this is implemented in a graphical user interface (see image). The visualisation of the pixels is executed when clicking the "Get Pixels" button. Initially I wanted this automatically to run once the polygon from the ROI action closes, but I didn't find a way to do that.
Hope this gives you an idea but maybe there are better ways.
February 4, 2014 at 05:26 am - Permalink
Thank you for your answer.
If I understand well, you are suggesting to transform my "versus graphic" into an image in order to "Cantor pairing" the pixels.
My little problem with this option is that the rest of my program is interacting with the data inside the "versus graphic" and I want to keep it dynamically updated when changing parameters (Threshold of intensity and brightness for example).
* The correlation between the pixels of the "maps images" and the pixels of my "versus graphic" is obvious in my case :
each pixel of the map has a [i][j] coordinate (256x256).
In the "Versus graphic" made from the vectorized maps each point has an index between 0 and 65536.
I can extract the coordinate in [i][j] of each point of my "versus graphic" doing this : [i] = floor (index/256) and [j] = mod(index, 256)
* If I manage to draw a rectangle in this graphic, when selecting several point with this rectangle, I will obtain their coordinate in the maps directly with their index.
But I don't know how to draw a rectangle in my "versus graphic" (and I don't know if it's possible) without changing it into image (to keep the live update I need). Moreover, I don't know how to identify the points selected in the graphic (like the masqueetomask tool which creates a mask with 0 and 1).
I'll keep going to find a solution and I'll try to adapt yours but, even if your work seems very close to mine, I'm not sure it will fit with my needs.
Thank you again :)
February 5, 2014 at 01:34 am - Permalink
Looking closer at your data it is probably not possible to easily adapt my approach to your data. The pairing works for integers, which in my case typically are between 0 and a few hundred (max) for both input images. The main advantage is to speed up the look-up process to find the desired pixel coordinates. The above approach is virtually instant for images up to 512*384 pixels (larger not tested). For me it is important to have the density plots because I'm looking for distinct populations with high pixel abundances of count pairs.
This you can do using
FindPointsInPolyandGraphWaveDraw, which can be used to achieve pretty much the same as the ROI mask does on the 2D histogram.February 5, 2014 at 02:04 am - Permalink
I will try to see if I can adapt them to my problem but they seem promissing.
February 5, 2014 at 08:21 am - Permalink
wave xw, yw, M_Hist, M_ROIMask
variable rows = DimSize(xw, 0)
variable cols = DimSize(xw, 1)
// Set pixels outside ROI to zero
MatrixOP/FREE/O M_PixHistROI = M_Hist * M_ROIMask
// convert ROI and histogram information into into 1D waves, keep index information on intensity
variable rowsHist = DimSize(M_PixHistROI , 0)
variable colsHist = DimSize(M_PixHistROI , 1)
Make/FREE/O/N=(rowsHist * colsHist) nPix, countsX, countsY
Multithread nPix = M_PixHistROI[p]
Multithread countsY= floor(p / rowsHist )
Multithread countsX = mod(p, rowsHist)
sort nPix, nPix, countsX, CountsY
// condese waves to rows that contain pixels
Multithread nPix = nPix == 0 ? NaN : nPix
variable MinCount = WaveMin(nPix)
Findlevel/P/Q nPix, MinCount
DeletePoints 0, (V_LevelX), nPix, countsX, countsY
variable nXYpairs = numPnts(nPix)
// make waves to keep results vom Cantor function
Make/FREE/O/I/U/N=(nXYPairs) ROISolutions
Make/FREE/O/I/U/N=(rows * cols) MapSolutions
// make unique integers using cantor pairing function
MultiThread ROISolutions = Cantor(countsX[p], countsY[p])
MultiThread MapSolutions = Cantor(xw[p], yw[p])
// Make result wave unsigned 8 bit to make it compatible with ImageMorphology
Make/O/B/U/N=(rows * cols) M_PixFromDensityPlot = 0
// make a point order wave and sort cantor integers
Make/FREE/O/N=(numPnts(MapSolutions)) PntOrder = p
Sort MapSolutions MapSolutions, PntOrder
Sort ROISolutions ROISolutions
// clip everything outside the WaveMin(ROIsolutions) to WaveMax(ROIsolutions) range in the map wave
FindLevel/Q/P MapSolutions, WaveMin(ROISolutions)
DeletePoints 0, V_LevelX, MapSolutions, PntOrder
FindLevel/Q/P MapSolutions, WaveMax(ROISolutions)+1
DeletePoints V_LevelX, inf, MapSolutions, PntOrder
variable np = numpnts(ROISolutions)
variable length = numpnts(MapSolutions)
Make/FREE/O/N=(length) tmp=NaN
//Find values from ROI in 1D Cantor wave MapSolutions
// BinarySearchInterp returns the point number if value is present in a wave or a fractional, interpolated pointnumber if value is not present
// use Mod(value, 1) to determine whether return value has a remainer when devided by 1
Multithread tmp = mod(binarySearchInterp(ROISolutions, MapSolutions[p]), 1) == 0 ? 1 : NaN
// eliminate points in PntOrder which are NaN
Multithread PntOrder *= tmp
WaveTransform zapNaNs PntOrder
// Fill output wave in 1D with 1 for pixels in ROI
variable i
for (i=0; i<numPnts(PntOrder); i+= 1)
M_PixFromDensityPlot[PntOrder[i]] = 1
endfor
// make 2D image from 1D wave
Redimension /N=(rows,cols) M_PixFromDensityPlot
Return M_PixFromDensityPlot
end
ThreadSafe function Cantor(aa, bb)
variable aa, bb
variable sumTerm = aa + bb
return 1/2 * (sumTerm) * (sumTerm + 1) + bb
end
The attached experiment shows an example. Execute
PixFromHistogram(Al, Si, M_Hist, M_ROIMask)to get a mask of the pixels of interest.
You can play with different ROI's on the histogram using "Analysis -> Packages -> Image Processing" then "Image -> ROI". Make sure you uncheck "Zero ROI pixels" in the panel.
February 6, 2014 at 03:56 am - Permalink
Okay it seems that I have a lot of work to adapt it to my issue :S
But with
FindPointsInPolyandGraphWaveDrawand with your code, I will find a way to do it.I'll let you know when it will be done ...
Thank you again !
February 6, 2014 at 06:13 am - Permalink
Have you looked into using the Marquee for this?
February 6, 2014 at 06:30 am - Permalink
With the marquee option, you can have a rectangle but you just identify the coordinates once. (right clicking and doing marquee2mask)
When it's done, I didn't find a way to shift the rectangle and to act dynamically on the image displaying the identified pixels (when dragging the rectangle)
February 10, 2014 at 07:03 am - Permalink
I just tried this on my code:
STRUCT WMWinHookStruct &s
switch(s.eventCode)
case 8:
print "modified"
// run code to save ROI using ImageGenerateROIMask and to extract pixels
break
endswitch
return 0
End
This works kind of dynamically after dragging the ROI and release of the mouse button, not while the ROI is moving. But there are side effects because this action may be triggered by other events than moving the ROI.
February 11, 2014 at 02:30 am - Permalink
I managed to get almost what I wanted using a little trick and only buttons.
I don't drag the rectangle but I shift it.
Thank you Chrlie for these 2 functions :
FindPointsInPolyandGraphWaveDraw-------------------------------------------------------------------------------------------------------------------------------------------------------------
// Allows the drawing of a polygone inside the Versus Graphic
Function SquareDRAW(Ctrlname) : ButtonControl
String Ctrlname
Variable k
String/G VSGraph
Variable/G BooleanDraw
Wave xWavePoly, yWavePoly, W_inPoly, PixelsToEnlight
k=1
if (BooleanDraw==1) // If the SquareDraw button has already been activated
DoAlert/T="Warning" 1, "The Polygone has already be drawn ! \r\n Do you want to erase it and draw another one ?"
if (V_flag==2)
k=0
endif
endif
Switch (k)
case 1: // Draw a new polygone
W_inPoly = 0
PixelsToEnlight = 0
SetDrawLayer/W=Prog_Window#BvsI/K UserBack
SetDrawLayer/W=Prog_Window#BvsI UserBack
GraphWaveDraw/W=Prog_Window#BvsI/O yWavePoly, xWavePoly
BooleanDraw = 1
break
case 0: // Don't draw a new polygone
break
Endswitch
End
-------------------------------------------------------------------------------------------------------------------------------------------------------------
-------------------------------------------------------------------------------------------------------------------------------------------------------------
// Identifies the pixels inside polygone of the Versus Graphic
Function SquareDONE(Ctrlname) : ButtonControl
String Ctrlname
Variable i, k
Variable/G Rows, Columns, BooleanDraw
Wave xWavePoly, yWavePoly, VInt, VBright, W_inPoly, PixelsToEnlight
k=1
if (BooleanDraw==0) // If the SquareDraw button has NOT already been activated
DoAlert/T="Warning" 0, "The Polygone has to be drawn first !"
k=0
endif
Switch (k)
case 1: // Indentifies the pixels inside the drawn polygone
FindPointsInPoly VInt, VBright, xWavePoly, yWavePoly
GraphNormal/W=Prog_Window#BvsI
For (i=0;(i<(Rows*Columns));i+=1)
if (W_inPoly[i]==1)
PixelsToEnlight[floor(i/columns)][mod(i, columns)] = 65536
endif
Endfor
BooleanDraw = 0
break
case 0: // No polygone drawn => no identification
break
Endswitch
End
-------------------------------------------------------------------------------------------------------------------------------------------------------------
-------------------------------------------------------------------------------------------------------------------------------------------------------------
// Displays the selected pixels inside the Intensity map
Function CorrelationON(Ctrlname) : ButtonControl
String Ctrlname
Variable k
Variable/G BooleanCorrel, BooleanDraw
Wave Intensity, PixelsToEnlight
k=1
if (BooleanDraw==1)
SquareDONE(Ctrlname)
endif
if (BooleanCorrel==1) // If the CorrelON button has already been activated
DoAlert/T="Warning" 0, "Selected pixels have already been displayed !"
k=0
endif
Switch (k)
case 1: // Creates the matrix of pixels to display and superimposes it on the map
ModifyImage/W=Prog_Window#Map1 Intensity ctab= {0.001,*,Grays,1};DelayUpdate
ModifyImage/W=Prog_Window#Map1 Intensity minRGB=(52224,52224,52224),maxRGB=0
AppendImage/W=Prog_Window#Map1 PixelsToEnlight; DelayUpdate
ModifyImage/W=Prog_Window#Map1 PixelsToEnlight ctab= {0.01,*,CyanMagenta,0};DelayUpdate
ModifyImage/W=Prog_Window#Map1 PixelsToEnlight minRGB=NaN,maxRGB=0
BooleanCorrel = 1
break
case 0: // Matrix already displayed
break
Endswitch
End
-------------------------------------------------------------------------------------------------------------------------------------------------------------
-------------------------------------------------------------------------------------------------------------------------------------------------------------
// Restore the intensity map.
Function CorrelationOFF(Ctrlname) : ButtonControl
String Ctrlname
Variable k
Variable/G BooleanDraw, BooleanCorrel
Wave Intensity, PixelsToEnlight
k=1
if (BooleanDraw==1)
SquareDONE(Ctrlname)
endif
if (BooleanCorrel==0) // If the CorrelOFF button has already been activated
DoAlert/T="Warning" 0, "Intensity map is already in normal mode"
k=0
endif
Switch (k)
case 1: // Removes the selected pixels from the intensity map
RemoveImage/W=Prog_Window#Map1 PixelsToEnlight
ModifyImage/W=Prog_Window#Map1 Intensity ctab= {*,*,SpectrumBlack,0};DelayUpdate
ModifyImage/W=Prog_Window#Map1 Intensity minRGB=0,maxRGB=0
BooleanCorrel = 0
break
case 0: // Selected pixels already removed
break
Endswitch
End
-------------------------------------------------------------------------------------------------------------------------------------------------------------
-------------------------------------------------------------------------------------------------------------------------------------------------------------
-------------------------------------------------------------------------------------------------------------------------------------------------------------
-------------------------------------------------------------------------------------------------------------------------------------------------------------
Function Left(Ctrlname) : ButtonControl
String Ctrlname
Variable i, k
Variable/G RectRadioVal
Variable/G BooleanDraw, BooleanCorrel, Xincrement, Rows, Columns
Wave xWavePoly, yWavePoly, W_inPoly, PixelsToEnlight, VInt, VBright
k=1
if (BooleanDraw==1)
DoAlert/T="Warning" 0, "Pixels inside the Polygone have to be identified first with the SquarDONE button"
k=0
endif
if (BooleanCorrel==0)
DoAlert/T="Warning" 0, "The correlation between Versus graphic and map should be enable first"
k=0
endif
Switch (k)
case 1: // translate the polygone to the left
If (RectRadioVal ==1) // Rectangle shift selected
For (i=0;(i<dimsize(xWavePoly, 0));i+=1)
xWavePoly[i] = xWavePoly[i] - Xincrement
Endfor
Endif
If (RectRadioVal==2) // Rectangle size increasement selected
xWavePoly[0] = xWavePoly[0]-Xincrement
xWavePoly[3] = xWavePoly[3]-Xincrement
xWavePoly[4] = xWavePoly[4]-Xincrement
Endif
RemoveImage/W=Prog_Window#Map1 PixelsToEnlight
PixelsToEnlight = 0
W_inPoly = 0
FindPointsInPoly VInt, VBright, xWavePoly, yWavePoly
For (i=0;(i<(Rows*Columns));i+=1)
if (W_inPoly[i]==1)
PixelsToEnlight[floor(i/columns)][mod(i, columns)] = 65536
endif
Endfor
AppendImage/W=Prog_Window#Map1 PixelsToEnlight; DelayUpdate
ModifyImage/W=Prog_Window#Map1 PixelsToEnlight ctab= {0.01,*,CyanMagenta,0};DelayUpdate
ModifyImage/W=Prog_Window#Map1 PixelsToEnlight minRGB=NaN,maxRGB=0
break
case 0: // No translation due to inactivation of Square or Correlation
break
Endswitch
End
-------------------------------------------------------------------------------------------------------------------------------------------------------------
-------------------------------------------------------------------------------------------------------------------------------------------------------------
And four buttons and associated functions are created : Left, Right, Up and Down with 2 setvariable : x-increment and y-increment.
If you think you will be intersted in this non-complete method, I can simplify my procedure file and post a saved experiment here with an exemple.
February 14, 2014 at 06:32 am - Permalink