changing the axis to natural log scale


Igor_user
Tue, 10/12/2010 - 11:44 am
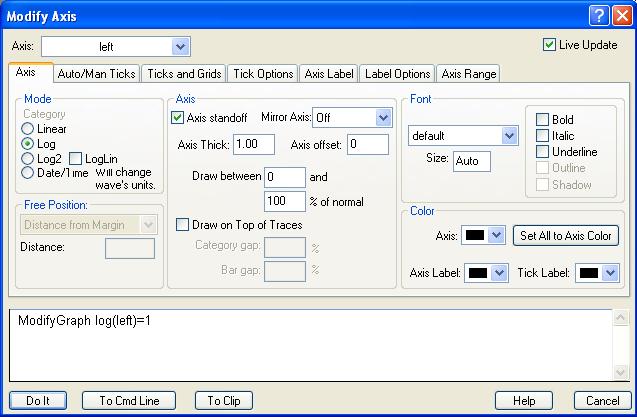
I have a problem with the graphic here, when i select to display the graph in natural log scale through the modify axis menu, the axis becomes something that doesn't make sense.
The graphs are attached here!

If you set the axis range to Auto, or manually set the minimum range to something positive, it should work fine.
Added a bit later: I tried setting a log axis on a graph with Autoscale from Zero in 6.20 and 6.00 and it worked fine. Apparently, Igor is doing the Right Thing- ignoring the Autoscale from Zero setting when switching to Log mode. In response to your query to support@wavemetrics.com, I have asked you what version of Igor you are using.
John Weeks
WaveMetrics, Inc.
support@wavemetrics.com
October 12, 2010 at 12:59 pm - Permalink
Thanks John, I will check that, my Igor version is 6.12A.
October 12, 2010 at 03:38 pm - Permalink