Mon, 06/23/2014 - 06:46 pm
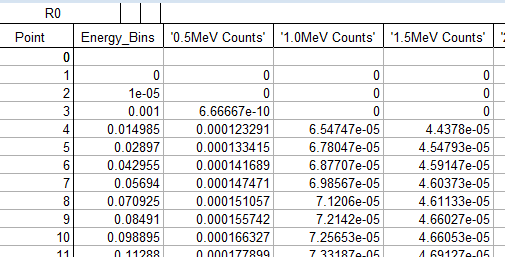
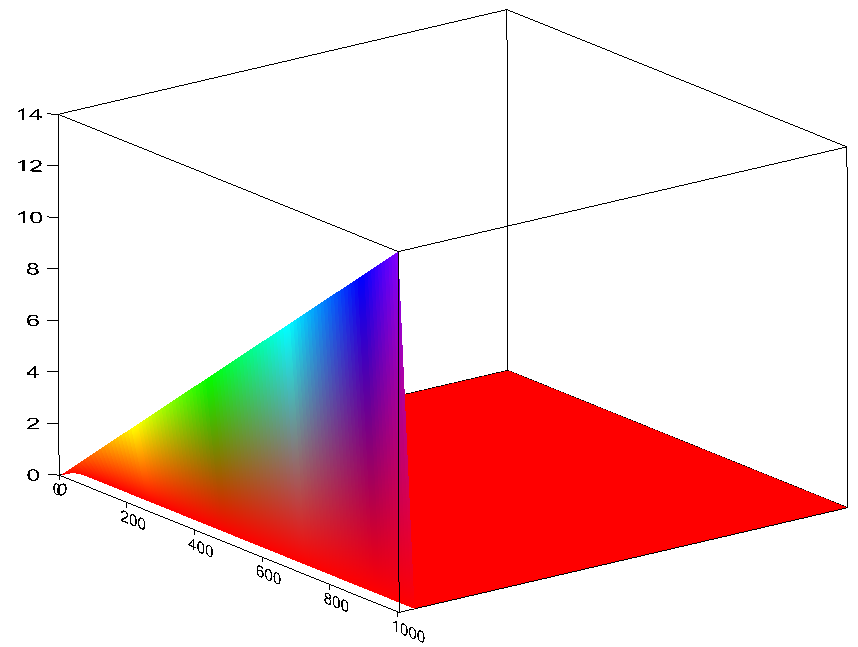
So I'm back with another plotting question. The data I work with is typically imported into IgorPro from an Excel spreadsheet, which as I understand it, causes each column from Excel to become a single 1D waveform in IgorPro. What I'm trying to do is plot a surface from several curves. The image I've attached (IgorData.PNG) shows the data as imported from Excel, the "energy" column should be the x-axis values, while each of the "count" waves represents a unique waveform as spread across the energy bins from the first column.From what I found in the manual it should be a simple process to make each of the "count" waves into a 2D waveform using the concatenate command. What I can't seem to figure out is how to create a surface plot which makes sense with the data I already have. I can concatenate them, making each "count" wave a different layer, but my ability ends there. This does indeed generate the surface (IgorPlot2.PNG), but the units on it do not make sense when related back to the data for each curve, and I cannot figure out how to change the axis labels as I would in a different plot.
IgorData.PNG
IgorPlot.PNG
IgorPlot2.PNG


•data = sin(p)*cos(q)*p*q
•SetScale/I x, -5, 30, "eV", data
•SetScale/I y, 30, 60, "deg", data
If you then create a surface plot from data you have the desired x and y axis.
Did I understood your problem correctly?
If no, please post a minimal working code example of your problem.
June 24, 2014 at 02:20 am - Permalink
Now to create your surface, you can start by creating a semicolon separated string listing all the waves in the desired order. For example, suppose your waves were named properly (no dots or spaces), and suppose the order you wanted them to appear was wave_1,wave14,wave_7,...,wave_3. In this case I'd execute:
String sss="wave_1;wave14;wave_7;wave_3;" // took out the .... for clarity.Now concatenate:
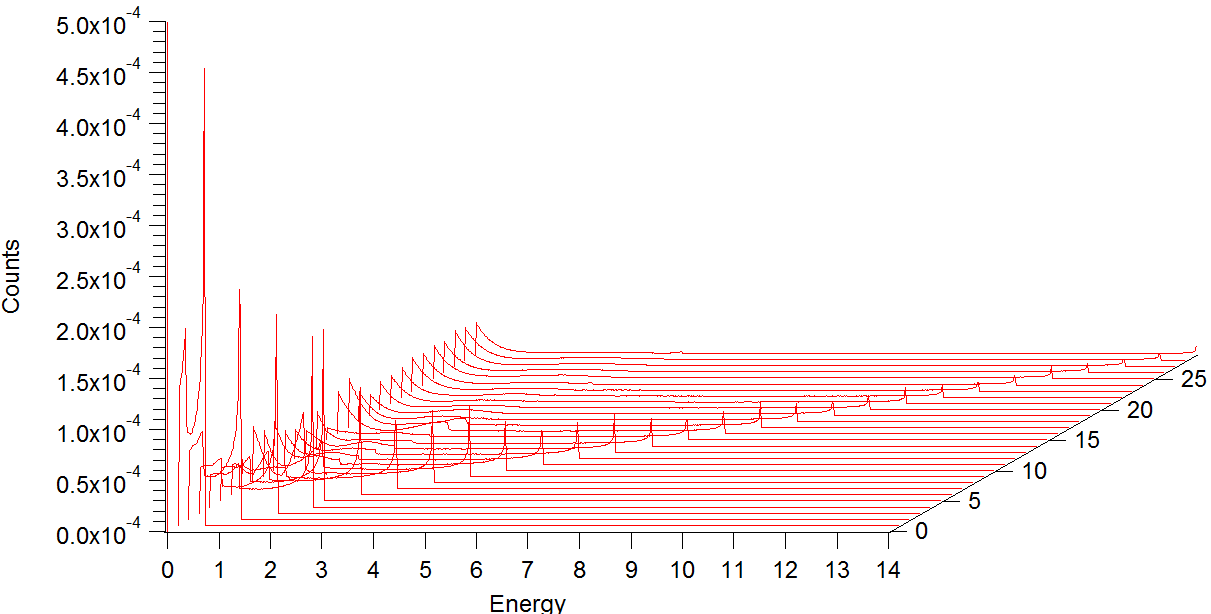
Concatenate sss,surfaceWaveNow you can apply the wave scaling using SetScale (I'll skip this step) and proceed to plot the surfaces. The first plot you have is actually a waterfall.
NewWaterfall surfaceWaveCheck the documentation for waterfall plot to find out more about this graph.
DisplayHelpTopic "Waterfall Plots"To display a Gizmo plot you can simply execute:
AppendToGizmo defaultSurface=surfaceWave
To find out more about Gizmo plot exeucte:
DisplayHelpTopic "Visualization"I hope this helps,
A.G.
WaveMetrics, Inc.
June 24, 2014 at 09:46 am - Permalink